Fig. 2
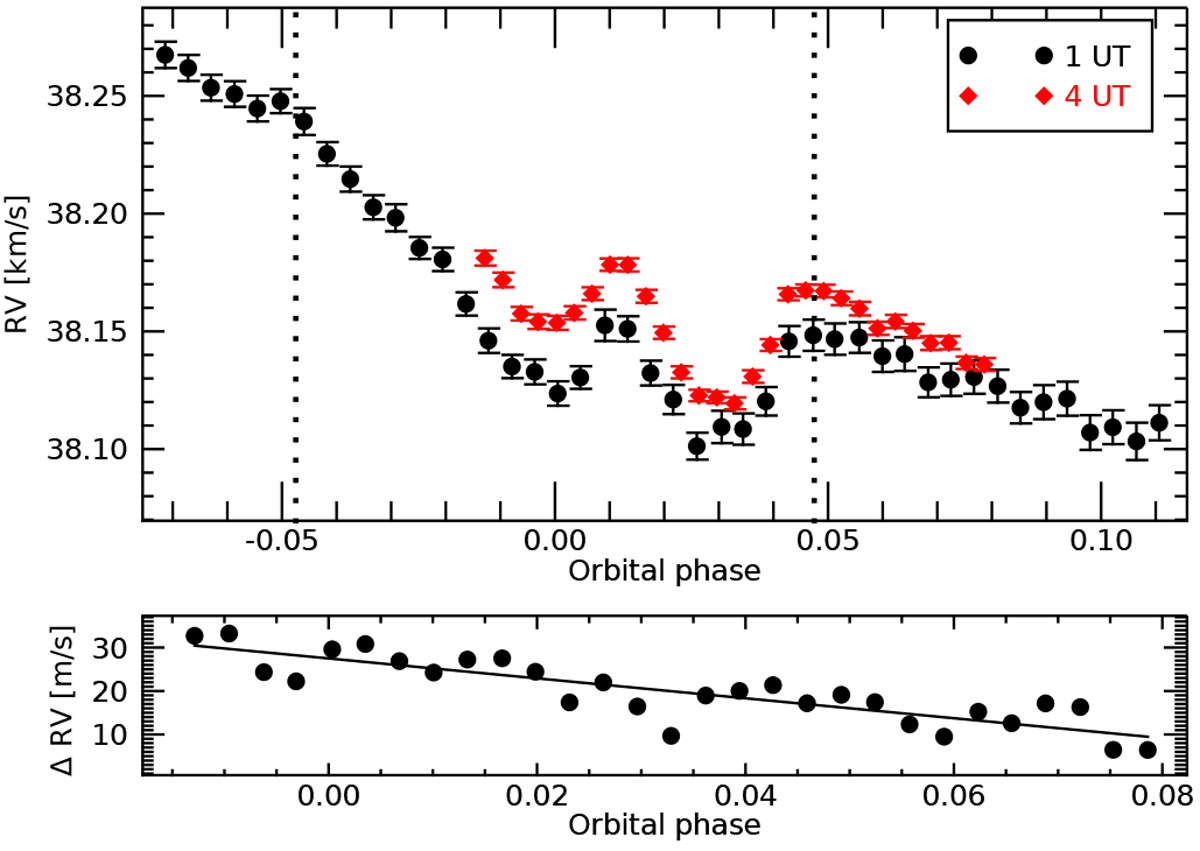
Top panel: ESPRESSO radial velocities of the WASP-121b transits observed. Vertical dotted lines indicate the expected beginning and end of the transit. Bottom panel: RV difference between the two transits, calculated by quadratically interpolating the 1-UT RVs on the 4-UT phases. The black line shows the fitted linear trend with a slope significant at the 4.5σ level. An offset is expected because of the different instrumental setups used in the two transits.
Current usage metrics show cumulative count of Article Views (full-text article views including HTML views, PDF and ePub downloads, according to the available data) and Abstracts Views on Vision4Press platform.
Data correspond to usage on the plateform after 2015. The current usage metrics is available 48-96 hours after online publication and is updated daily on week days.
Initial download of the metrics may take a while.