Fig. 14
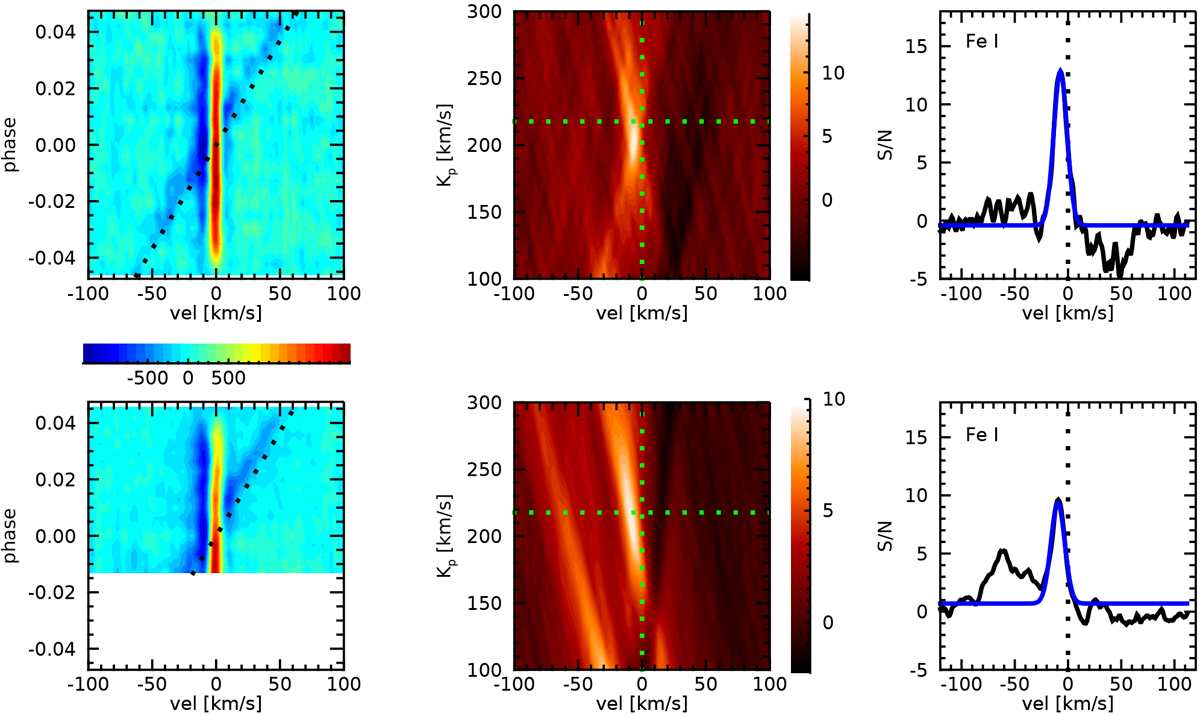
Cross-correlation of the data with the Fe I model. Shown are the results for the 1-UT transit (top), and those for the 4-UT transit (bottom). The first column shows the contour plots of the temporal variation of the cross-correlation, with a dashed line to show the expected planetary velocity; the colorbar scale is in ppm. The second column is the Kp versus velocity map after summing the cross-correlations for different Kp, with colorbar scale in S/N. Green dashed lines are centered on the expected planetary position. The third column shows the final S/N of the detection, with the performed Gaussian fit in blue, as calculated at the theoretical Kp value.
Current usage metrics show cumulative count of Article Views (full-text article views including HTML views, PDF and ePub downloads, according to the available data) and Abstracts Views on Vision4Press platform.
Data correspond to usage on the plateform after 2015. The current usage metrics is available 48-96 hours after online publication and is updated daily on week days.
Initial download of the metrics may take a while.