Fig. 13
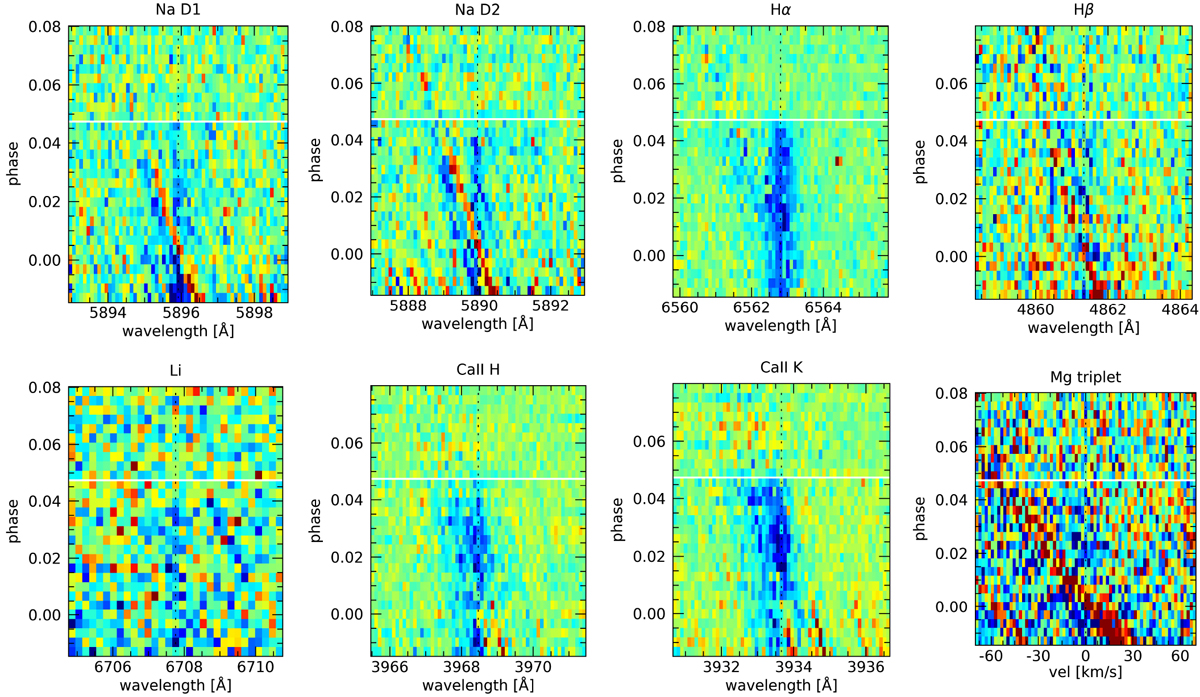
Tomography positive quality checks of the detections in the planetary restframe, for the 4-UT partial transit, before applying the stellar contamination correction (this also shows the restframe of the Doppler shadow, i.e., the red track). Each square represents a 0.1 Å bin on the horizontal scale (except 0.2 Å for Li and 1 km s−1 for Mg). The color scale (not shown here as these are qualitative plots) is different for each plot, from blue representing absorption to red representing emission. The vertical dotted lines represent the laboratory wavelength. The horizontal white lines represent the end of the transit. The Mg tomography (bottom right plot) is presented in the velocity space as the sum of the three lines of the triplet.
Current usage metrics show cumulative count of Article Views (full-text article views including HTML views, PDF and ePub downloads, according to the available data) and Abstracts Views on Vision4Press platform.
Data correspond to usage on the plateform after 2015. The current usage metrics is available 48-96 hours after online publication and is updated daily on week days.
Initial download of the metrics may take a while.