Fig. 9
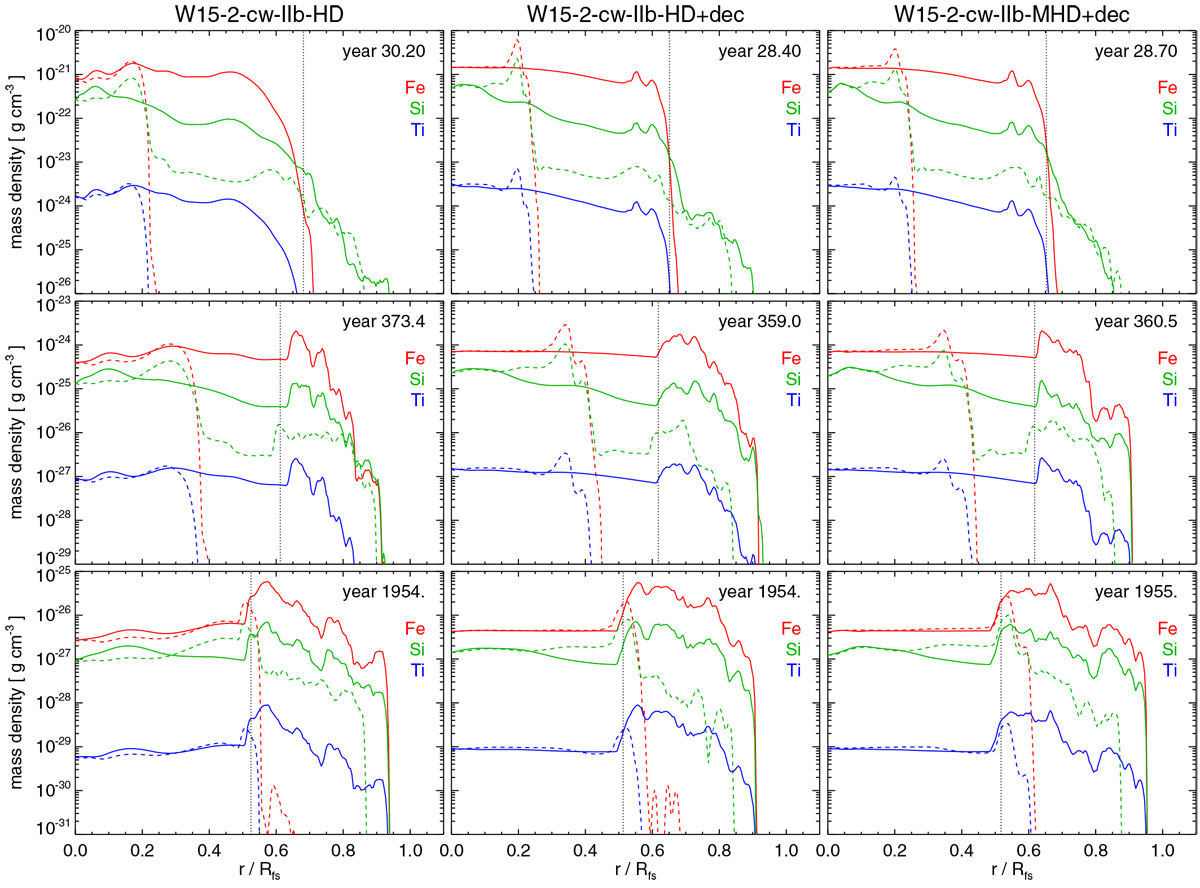
Radial profiles of Fe (red), Ti (blue), and Si (green) averaged over a solid angle of 30° in the direction of the east Fe-rich finger (roughly along the negative x-axis in the left panels of Fig. 7; solid lines) and of the negative z-axis (i.e., where no Fe-rich finger is present; dashed lines) for our three models, at three different epochs. The vertical dotted line in each panel marks the average position of the reverse shock. The density of Ti was calculated by considering the tracer-particle-based post-processing with a large nuclear network (Wongwathanarat et al. 2017), but not considering its decay in 44Ca (for an e-folding time of 90 yr, the Ti density is scaled by a factor of 0.027).
Current usage metrics show cumulative count of Article Views (full-text article views including HTML views, PDF and ePub downloads, according to the available data) and Abstracts Views on Vision4Press platform.
Data correspond to usage on the plateform after 2015. The current usage metrics is available 48-96 hours after online publication and is updated daily on week days.
Initial download of the metrics may take a while.