Fig. 8
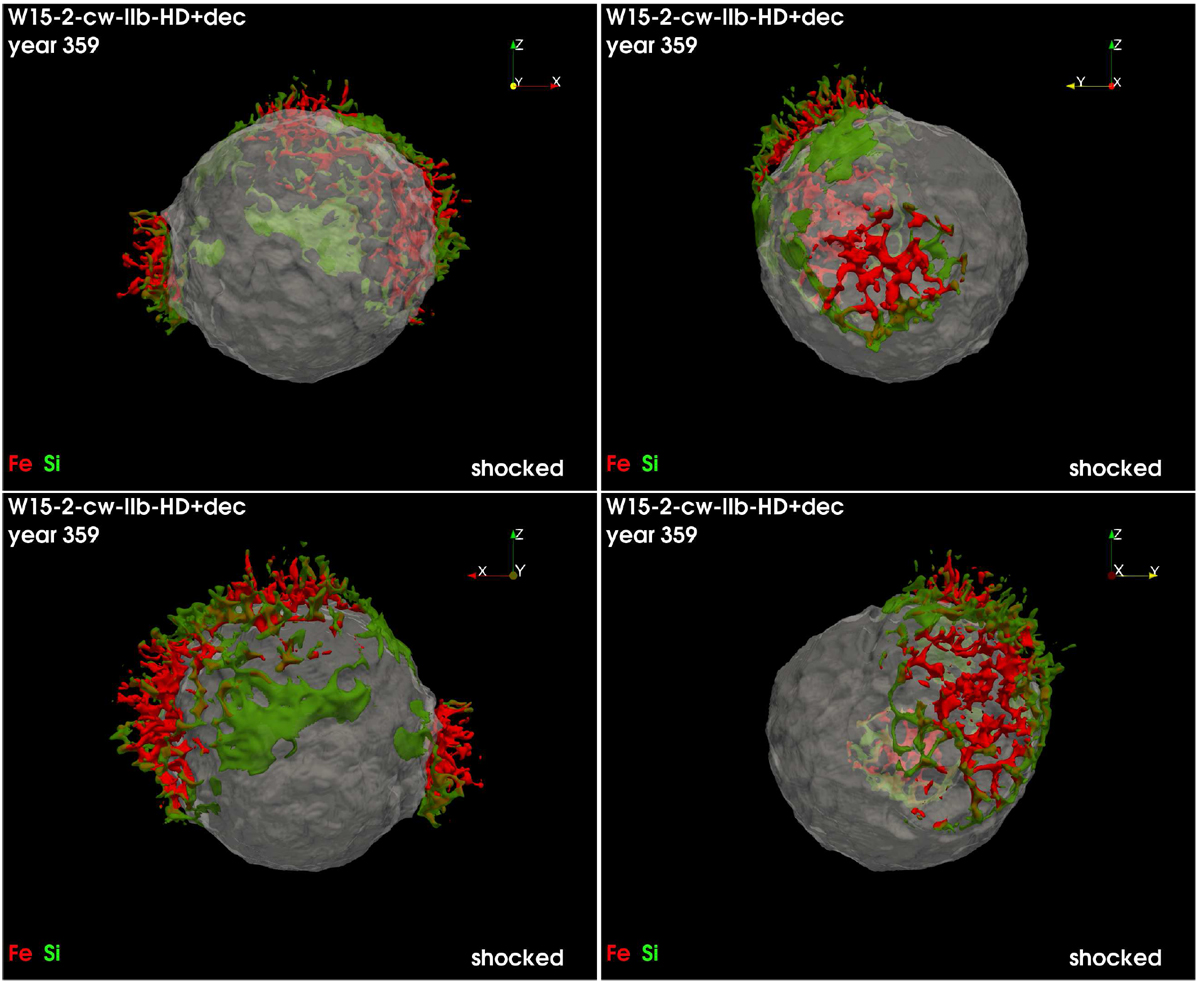
Isosurfaces of the distributions of shocked Fe (red) and Si (green) at the age of Cas A for different viewing angles for model W15-2-cw-IIb-HD+dec. The upper left panel corresponds to the vantage point at Earth for Cas A. The opaque irregular isosurfaces correspond to a value of Fe and Si density which is at 25% of the respective peak density. The semi-transparent white surface indicates the reverse shock. See online Movie 2 for an animation of these data; a navigable 3D graphic of these distributions which includes also unshocked Fe and Si is available at https://skfb.ly/6UJYu.
Current usage metrics show cumulative count of Article Views (full-text article views including HTML views, PDF and ePub downloads, according to the available data) and Abstracts Views on Vision4Press platform.
Data correspond to usage on the plateform after 2015. The current usage metrics is available 48-96 hours after online publication and is updated daily on week days.
Initial download of the metrics may take a while.