Fig. 7
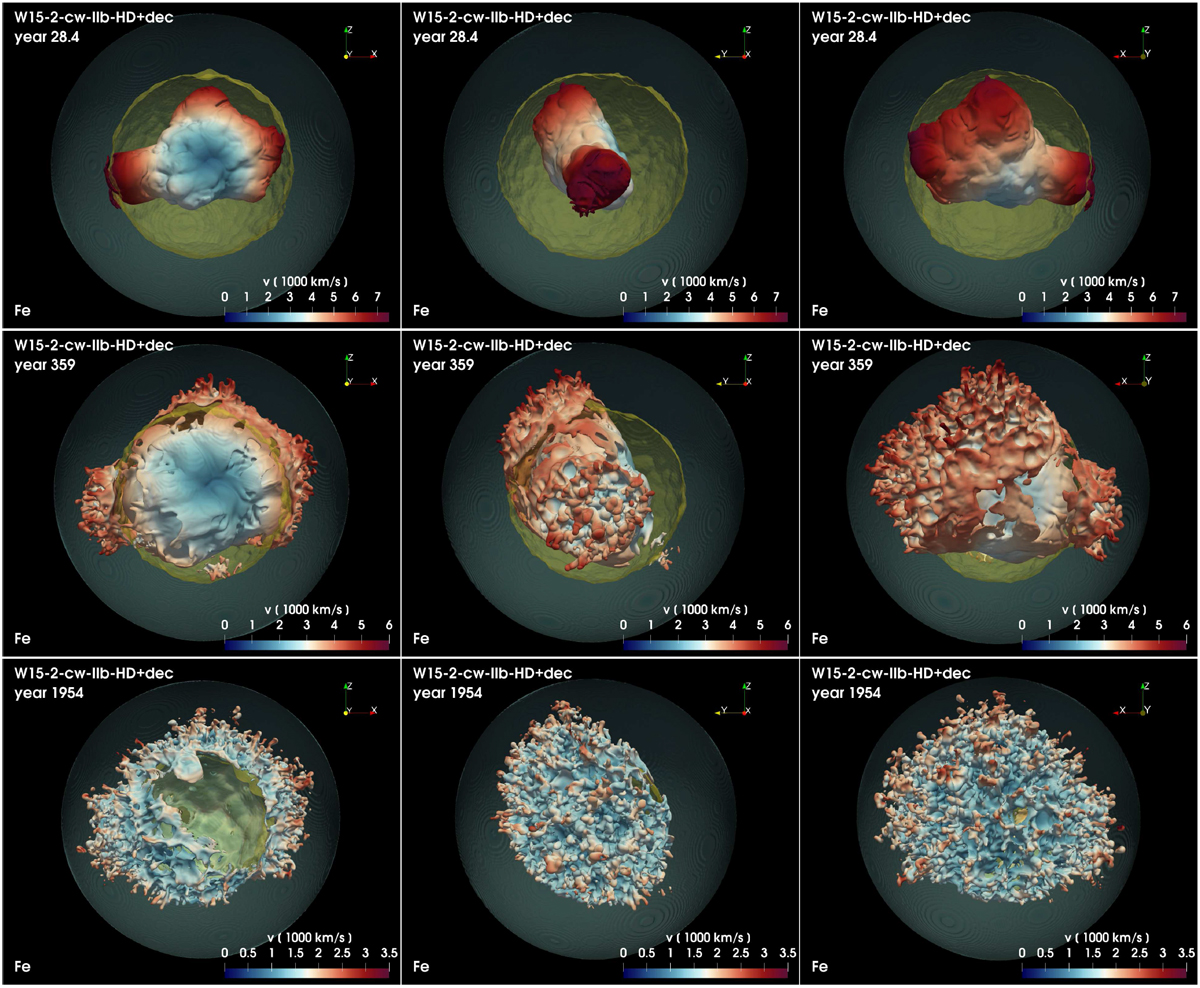
Isosurfaces of the distribution of Fe at the time when the reverse shock starts to interact with the Fe- and Ti-rich plumes of ejecta (upper panels), at the age of Cas A (middle panels), and at t = 2000 yr (lower panels) for different viewing angles (from left to right) for model W15-2-cw-IIb-HD+dec. The opaque irregular isosurfaces correspond to a value of Fe density which is at 5% of the peak density; their colors give the radial velocity in units of 1000 km s−1 on the isosurface (the color coding is defined at the bottom of each panel). The semi-transparent clipped quasi-spherical surfaces indicate the forward (green) and reverse (yellow) shocks. The Earth vantage point lies on the negative y-axis. See online Movie 1foran animation of these data; a navigable 3D graphic of the Fe spatial distribution at the age of Cas A is available at https://skfb.ly/6TKRK.
Current usage metrics show cumulative count of Article Views (full-text article views including HTML views, PDF and ePub downloads, according to the available data) and Abstracts Views on Vision4Press platform.
Data correspond to usage on the plateform after 2015. The current usage metrics is available 48-96 hours after online publication and is updated daily on week days.
Initial download of the metrics may take a while.