Free Access
Fig. 5
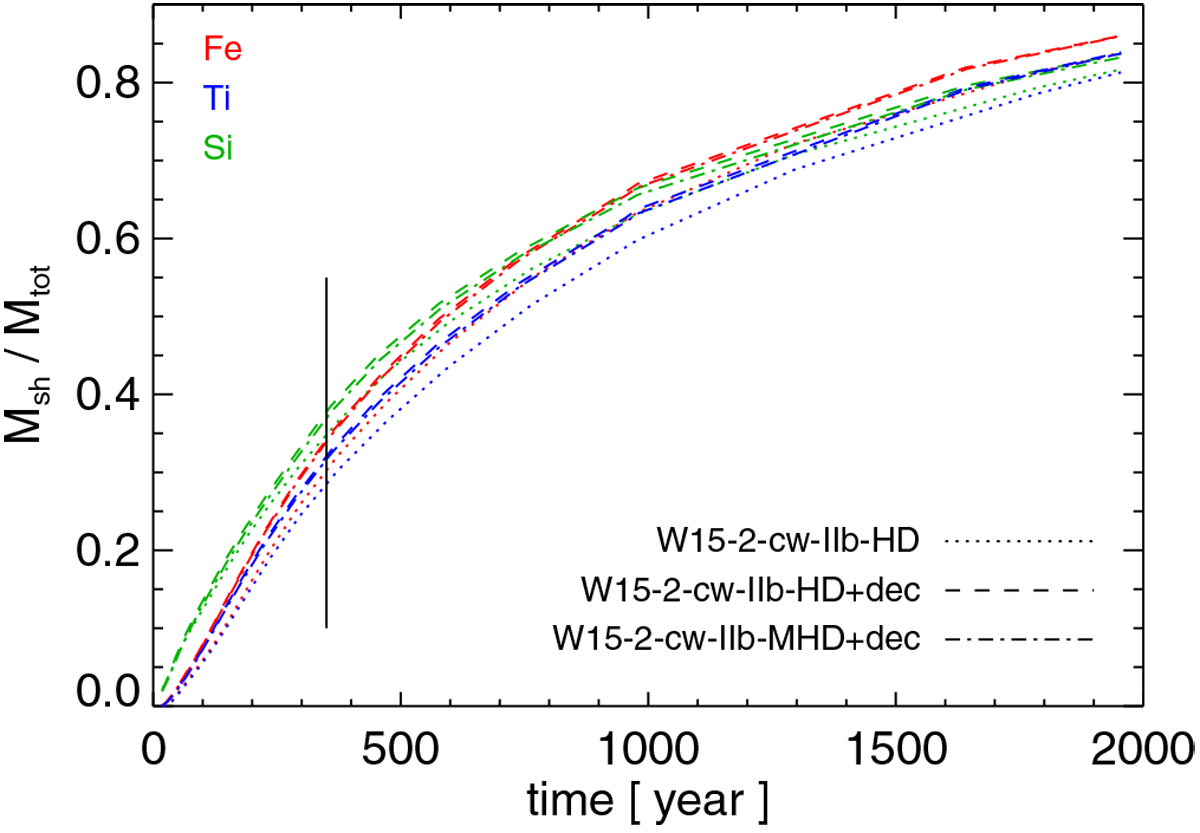
Mass of shocked Si (green lines), Ti (blue), and Fe (red) normalized to their total mass versus time for the three SNR modelsanalyzed. The vertical black line marks the age of Cas A.
Current usage metrics show cumulative count of Article Views (full-text article views including HTML views, PDF and ePub downloads, according to the available data) and Abstracts Views on Vision4Press platform.
Data correspond to usage on the plateform after 2015. The current usage metrics is available 48-96 hours after online publication and is updated daily on week days.
Initial download of the metrics may take a while.