Fig. 19
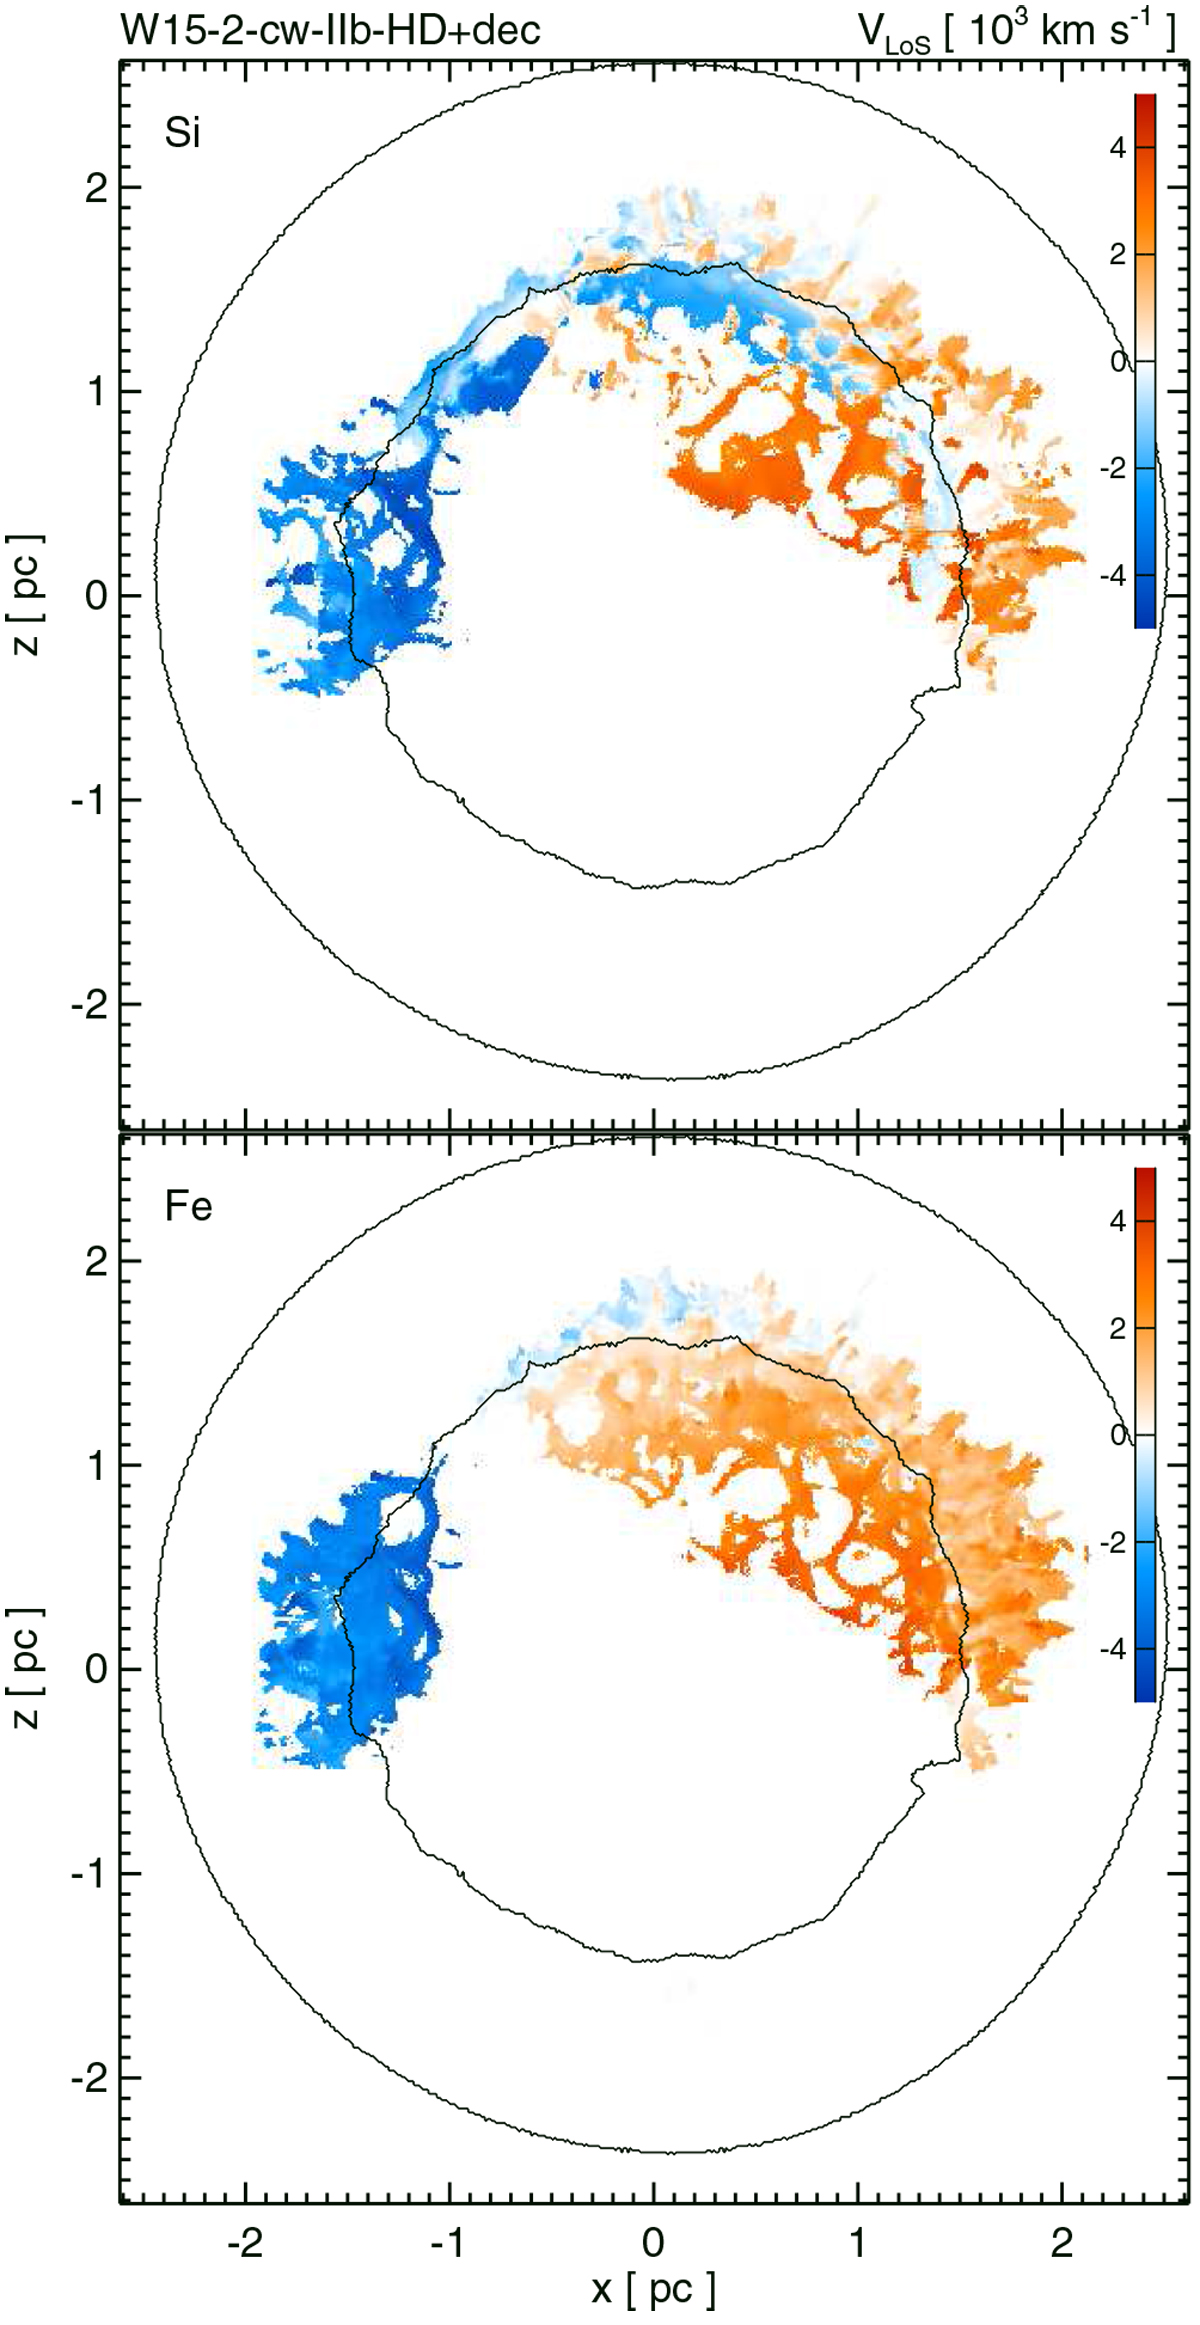
Maps of average EM-weighted velocity along the LoS for shocked Si (upper panel) and Fe (lower panel) at the age of Cas A for model W15-2-cw-IIb-HD+dec. The approximate velocity range is ± 5000 km s−1 (see color bar on the right in units of 1000 km s−1). The solid contours mark the cuts of the forward and reverse shocks in the plane of the sky passing through the center of the explosion. These images correspond to the effective Doppler maps derived from observations.
Current usage metrics show cumulative count of Article Views (full-text article views including HTML views, PDF and ePub downloads, according to the available data) and Abstracts Views on Vision4Press platform.
Data correspond to usage on the plateform after 2015. The current usage metrics is available 48-96 hours after online publication and is updated daily on week days.
Initial download of the metrics may take a while.