Fig. 18
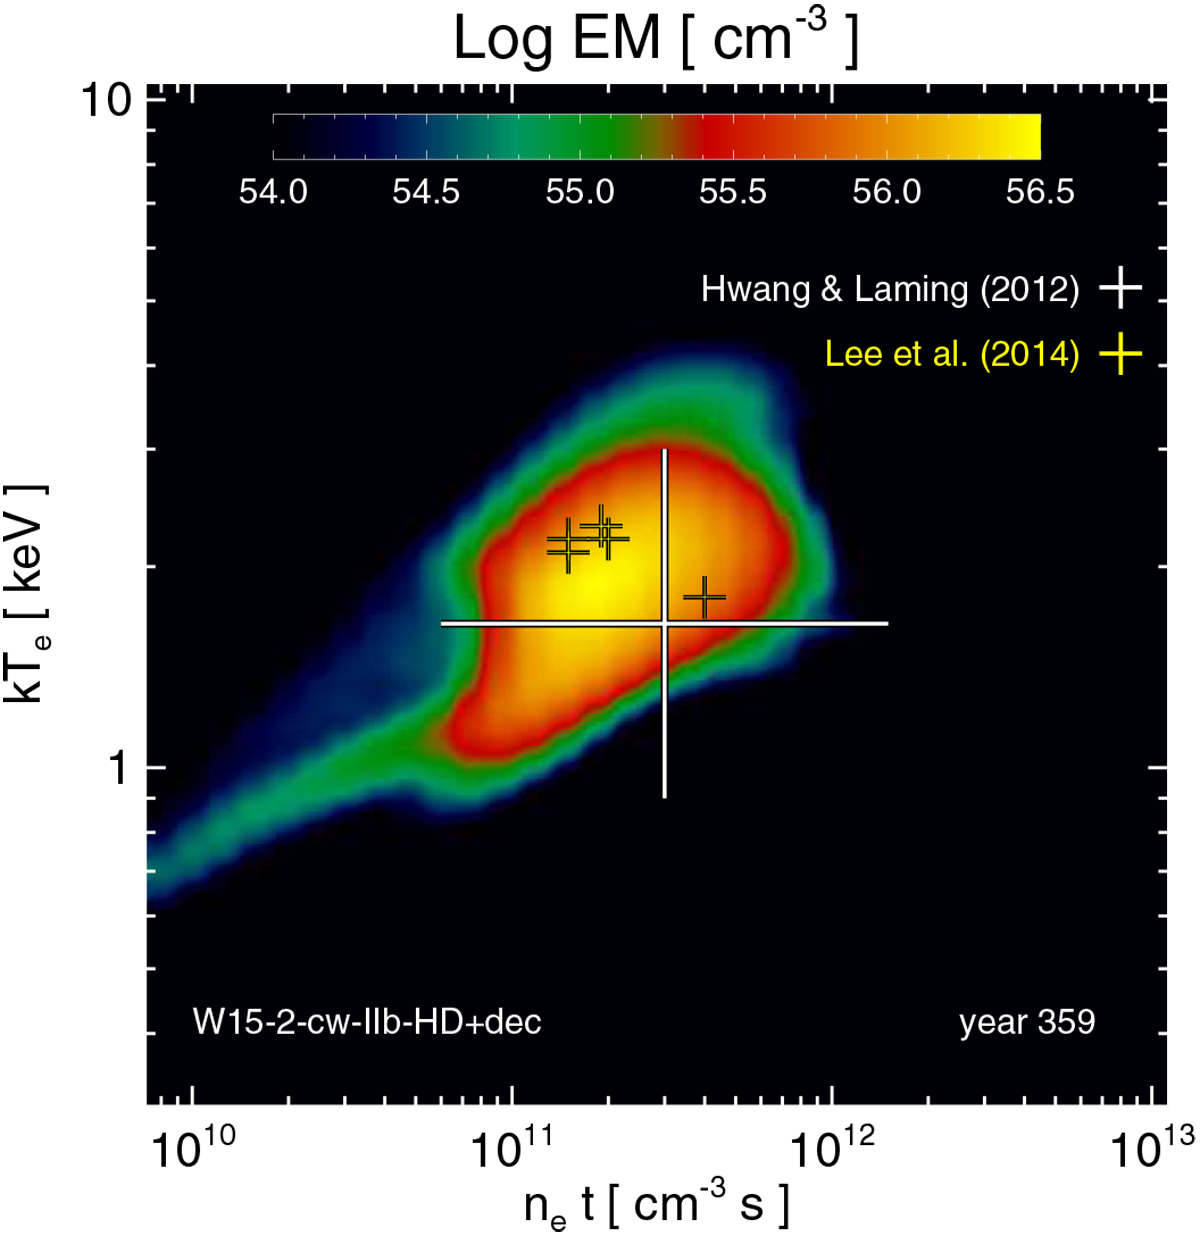
Distribution of emission measure versus electron temperature (kTe) and ionization age (net) at the epoch of Cas A derived from model W15-2-cw-IIb-HD+dec compared with the results of Chandra X-ray observations. The large white cross marks the ranges of kTe and ne t derived from an X-ray survey of ejecta in Cas A (Hwang & Laming 2012); the small yellow crosses mark the values inferred from the analysis of regions dominated by thermal emission of shocked ambient gas (Lee et al. 2014).
Current usage metrics show cumulative count of Article Views (full-text article views including HTML views, PDF and ePub downloads, according to the available data) and Abstracts Views on Vision4Press platform.
Data correspond to usage on the plateform after 2015. The current usage metrics is available 48-96 hours after online publication and is updated daily on week days.
Initial download of the metrics may take a while.