Fig. 16
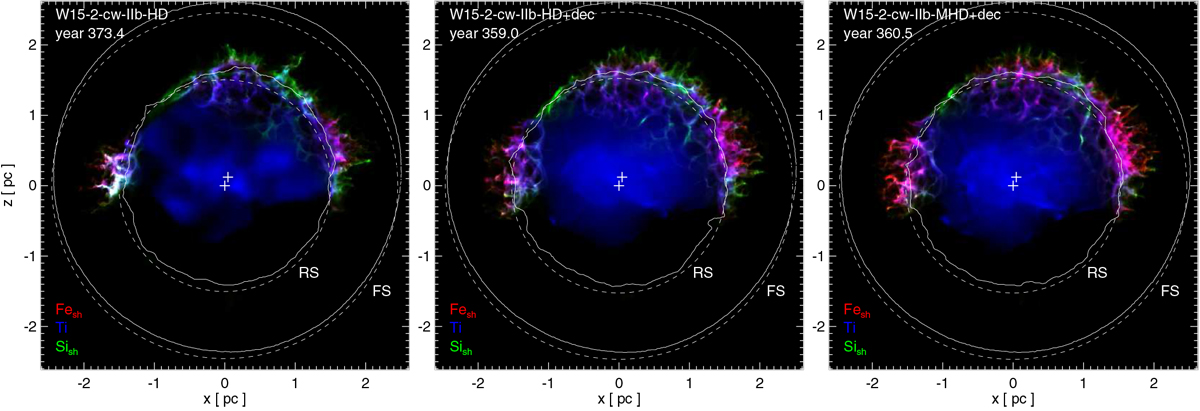
Emission measure, EM, of shocked Fe (red) and Si (green) integrated along the y-axis (i.e., the LoS assuming the vantage point at Earth), and column density, nTi, of Ti (both shocked and unshocked; blue) at the age of Cas A for our three models. The solid contours mark cuts of the forward andreverse shocks in the plane of the sky passing through the center of the explosion; the dashed lines mark the same cuts but for spheres with the centers coincident with the center of explosion and radii corresponding to the average radii of the forward and reverse shocks. The two crosses in each panel mark the center of the explosion and the geometric center of the forward and reverse shocks offset to the northwest.
Current usage metrics show cumulative count of Article Views (full-text article views including HTML views, PDF and ePub downloads, according to the available data) and Abstracts Views on Vision4Press platform.
Data correspond to usage on the plateform after 2015. The current usage metrics is available 48-96 hours after online publication and is updated daily on week days.
Initial download of the metrics may take a while.