Fig. 14
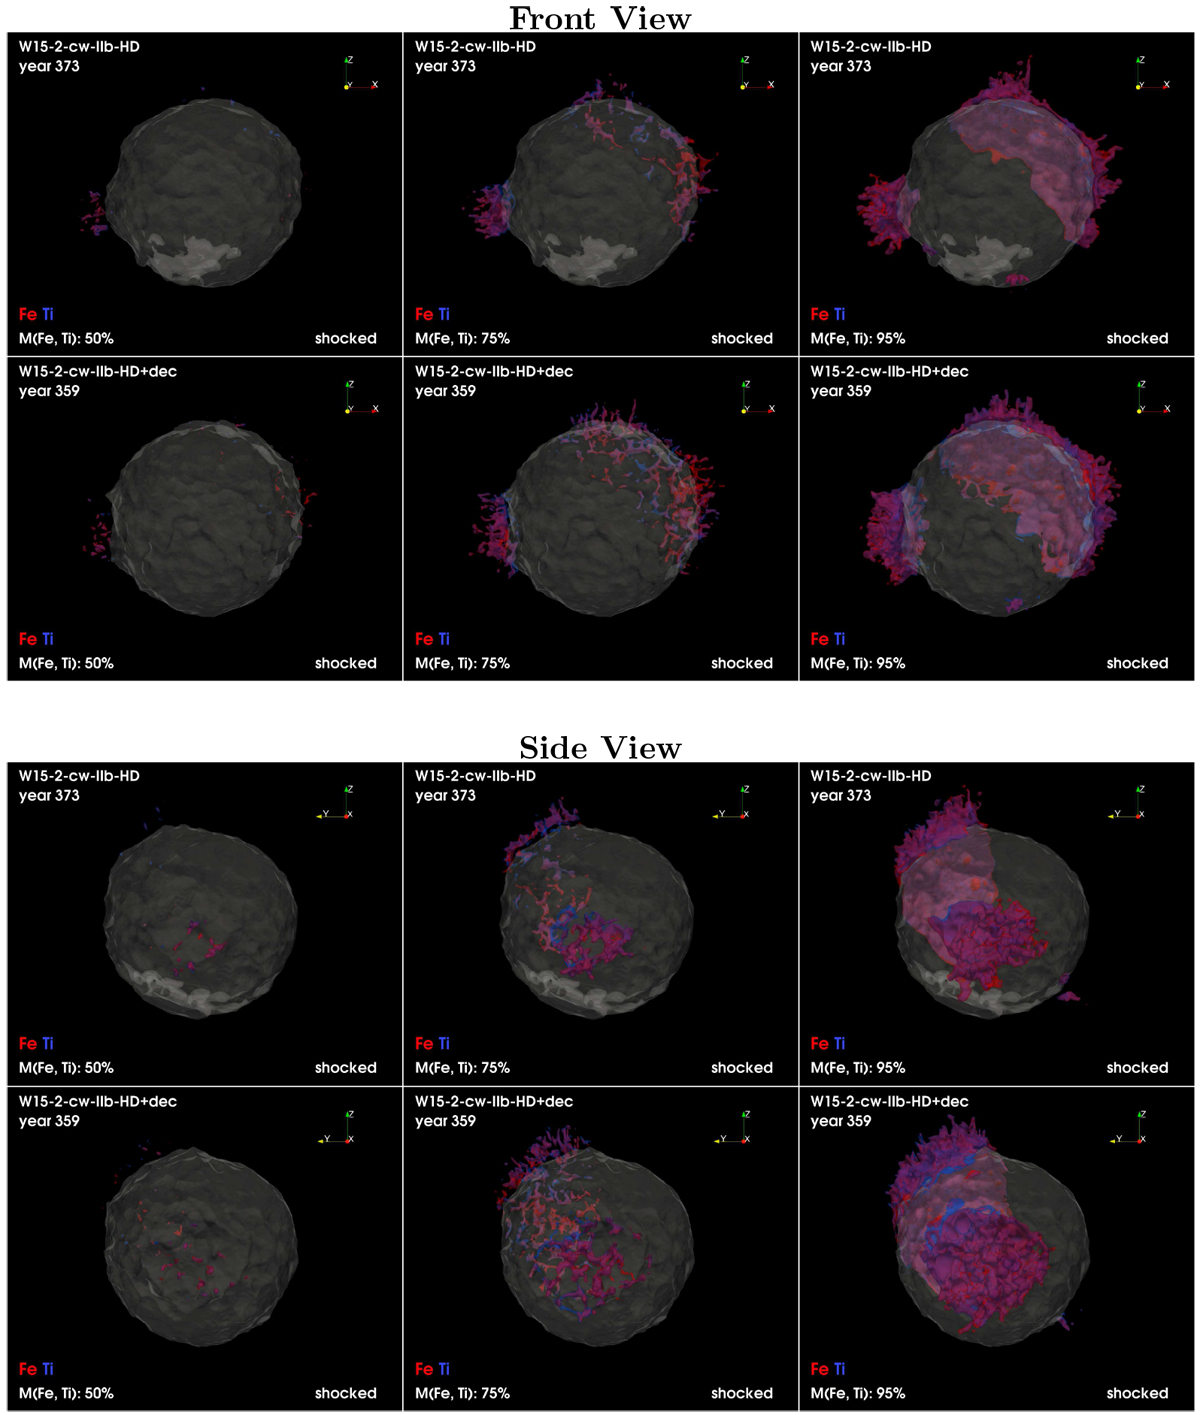
Same as in Fig. 12, but for the distributions of shocked Fe (red) and Ti (blue). The values of the mass fractions are selected so that the corresponding isosurfaces enclose, from left to right, 50, 75, and 95% of the total mass of the respective shocked species. The red isosurfaces correspond to a value of Fe density in model W15-2-cw-IIb-HD (W15-2-cw-IIb-HD+dec) which is, in units of 10−25 g cm−3, 72 (50), 35 (26), 7.5 (7.9), respectively; the blue isosurfaces correspond to a value of Ti density in model W15-2-cw-IIb-HD (W15-2-cw-IIb-HD+dec) which is, in units of 10−26 g cm−3 (considering the tracer-particle-based post-processing with a large nuclear network, Wongwathanarat et al. 2017, but not considering its decay in 44Ca), 21 (15), 10 (7.9), 2.8 (2.5), respectively (considering the decay of 44Ti in 44Ca, these values are scaled by a factor of 0.027, for an e-folding time of 90 yr). A navigable 3D graphic of these distributions is available at https://skfb.ly/6UMxI.
Current usage metrics show cumulative count of Article Views (full-text article views including HTML views, PDF and ePub downloads, according to the available data) and Abstracts Views on Vision4Press platform.
Data correspond to usage on the plateform after 2015. The current usage metrics is available 48-96 hours after online publication and is updated daily on week days.
Initial download of the metrics may take a while.