Fig. 13
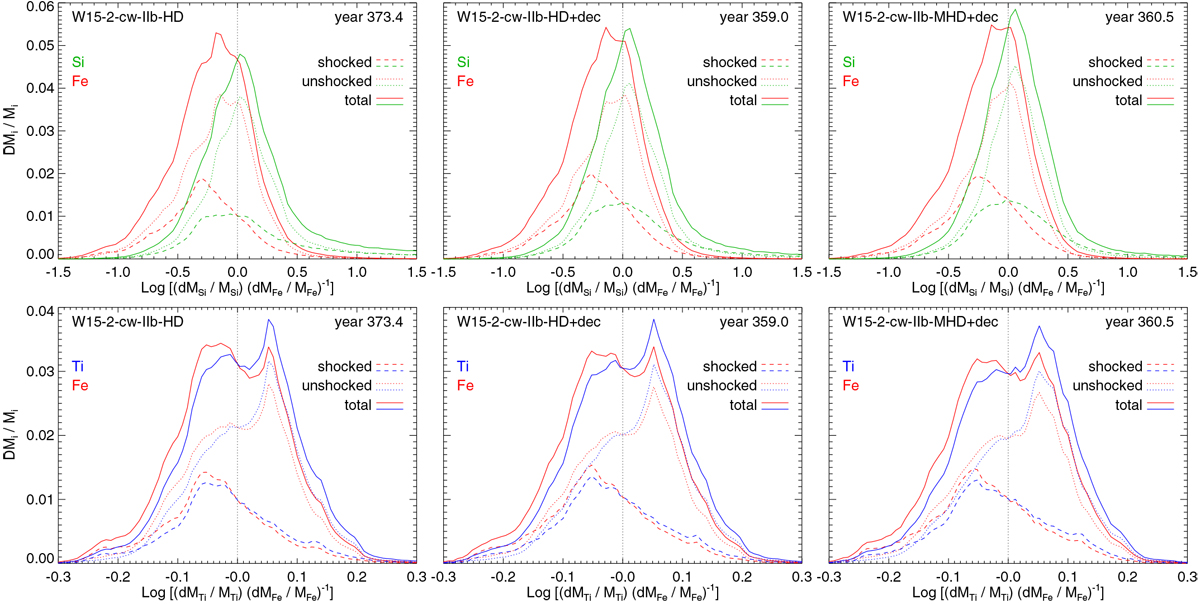
Mass distribution of Si (green), Ti (blue), and Fe (red) versus the ratio ![]() (where i stands for Si or Ti) at the age of Cas A for the three models. The solid lines correspond to the total distributions; the dotted (dashed) lines display the distributions of unshocked (shocked) ejecta. The vertical dotted black lines indicate an equal concentration of two species (Ri,Fe = 0).
(where i stands for Si or Ti) at the age of Cas A for the three models. The solid lines correspond to the total distributions; the dotted (dashed) lines display the distributions of unshocked (shocked) ejecta. The vertical dotted black lines indicate an equal concentration of two species (Ri,Fe = 0).
Current usage metrics show cumulative count of Article Views (full-text article views including HTML views, PDF and ePub downloads, according to the available data) and Abstracts Views on Vision4Press platform.
Data correspond to usage on the plateform after 2015. The current usage metrics is available 48-96 hours after online publication and is updated daily on week days.
Initial download of the metrics may take a while.