Fig. 10
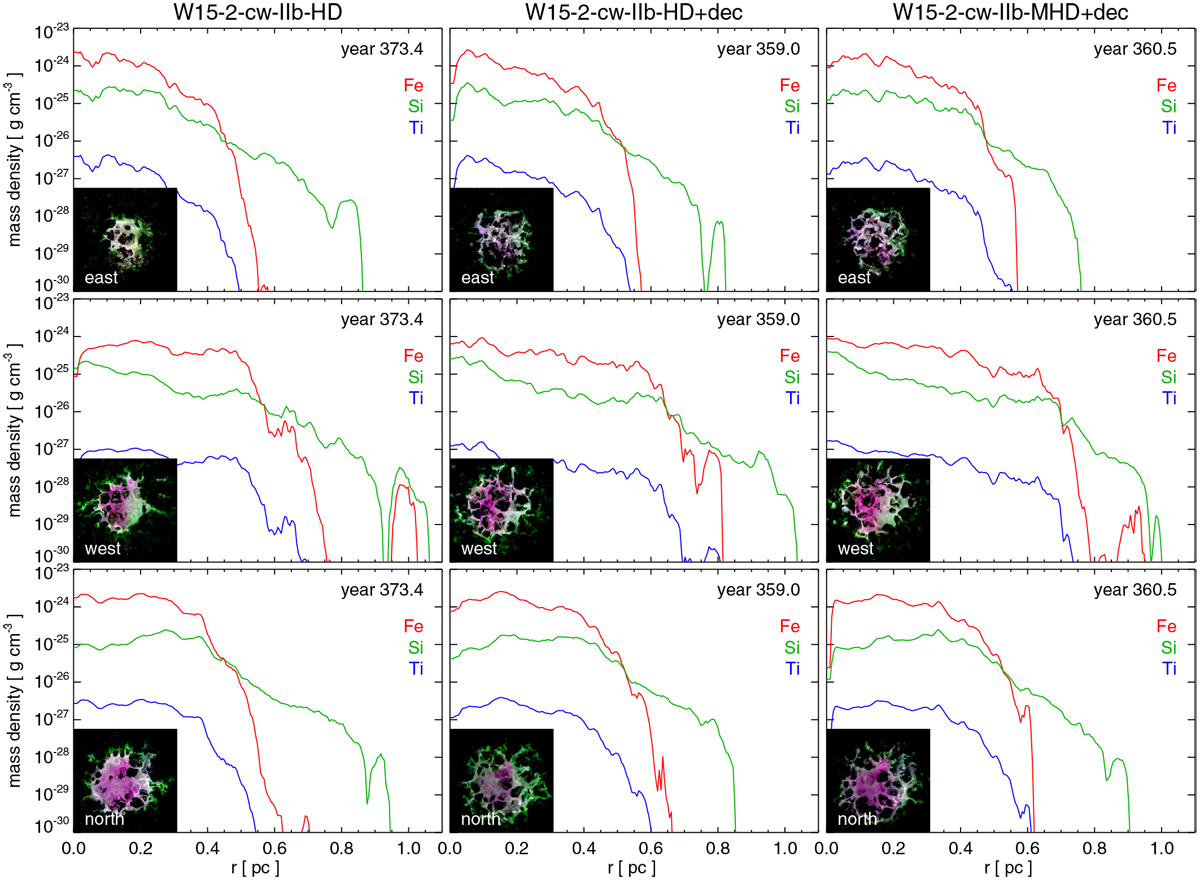
Profiles of Fe (red), Ti (blue), and Si (green) as a function of the distance from the center of the Fe finger that roughly points to the east (top row), to the west (middle row) and to the north (botton row), at the age of Cas A, for our three models. The profiles are averaged over all directions in a plane tangential to the sphere at r ≈ 0.7 Rfs from the center of the explosion (namely immediately above the reverse shock). The density of Ti was calculated by considering the tracer-particle-based post-processing with a large nuclear network (Wongwathanarat et al. 2017), but not considering its decay in 44Ca (for an e-folding time of 90 yr, the Ti density is scaled by a factor of 0.027). The inset in the lower left corner of each panel shows a three-color composite image of the mass density distributions of Fe (red), Ti (blue), and Si (green) in the plane at r ≈ 0.7 Rfs.
Current usage metrics show cumulative count of Article Views (full-text article views including HTML views, PDF and ePub downloads, according to the available data) and Abstracts Views on Vision4Press platform.
Data correspond to usage on the plateform after 2015. The current usage metrics is available 48-96 hours after online publication and is updated daily on week days.
Initial download of the metrics may take a while.