Fig. 2.
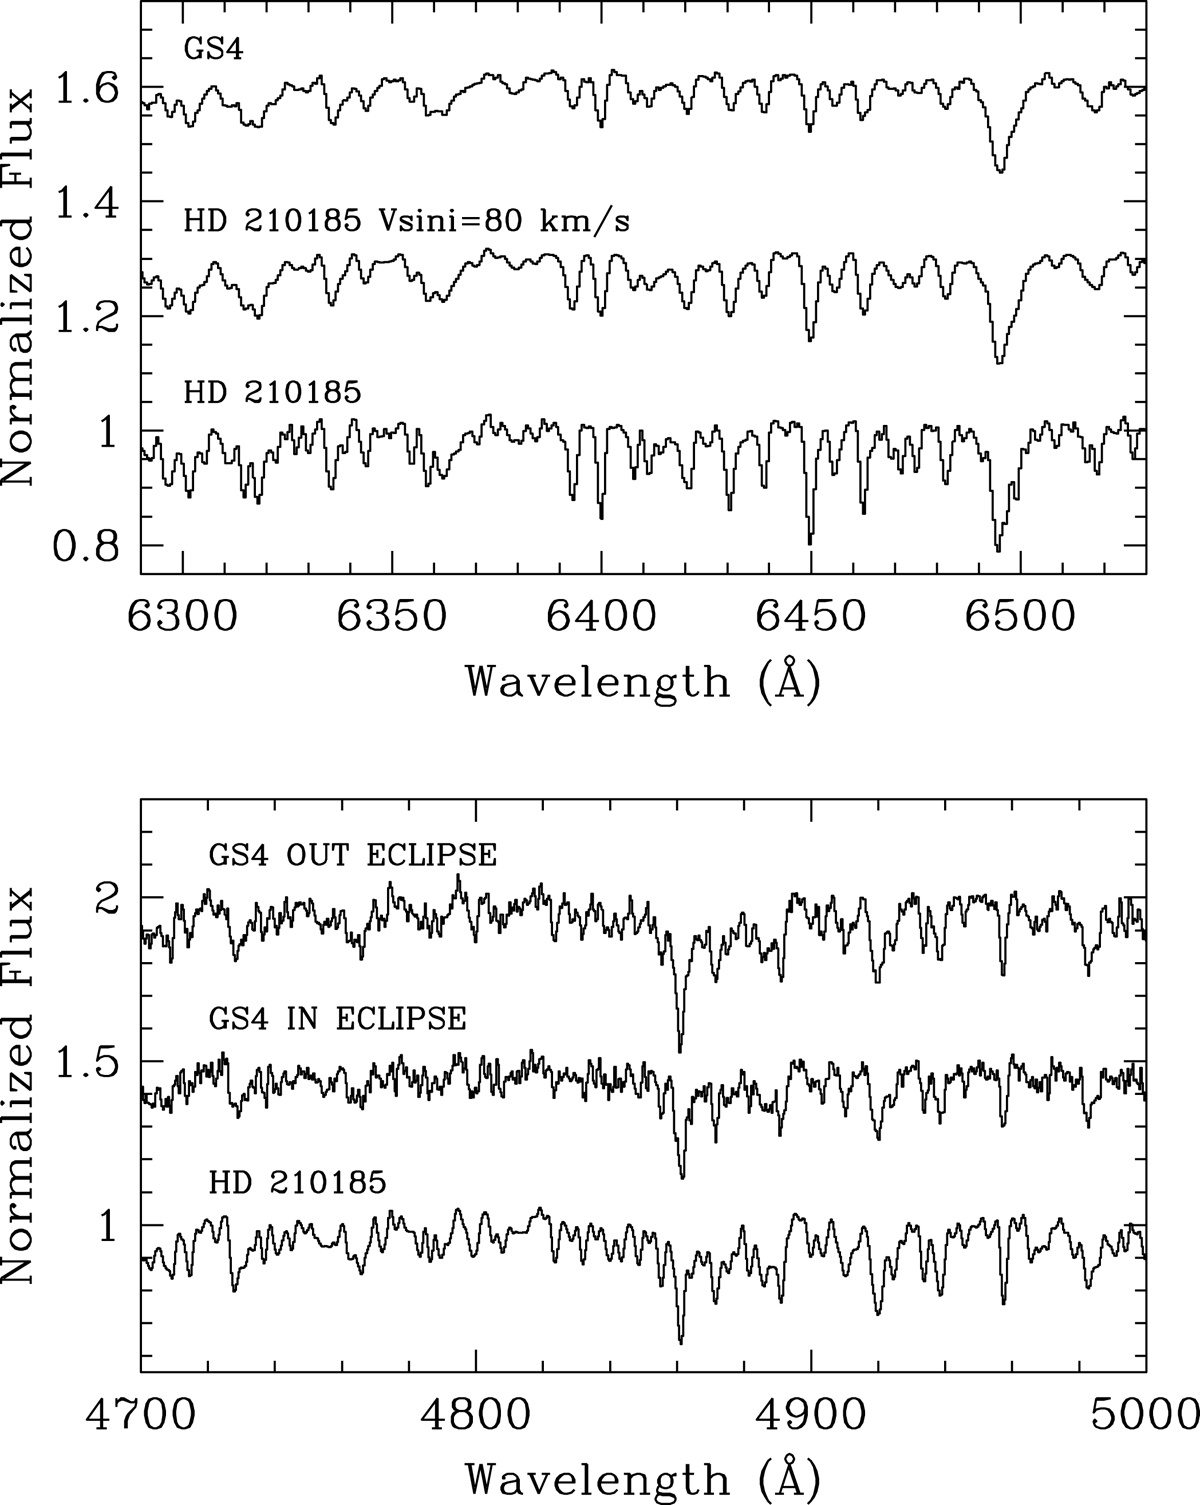
Sample of LT spectra. Top: from bottom to top: red-arm LT spectrum of HD 210185 (the K0III template), the same spectrum broadened by 80 km s−1, and the Doppler-corrected average spectrum of GS4. Bottom: from bottom to top: blue-arm LT spectrum of the K0III template in comparison with the Doppler-corrected averages of GS4 obtained during the primary eclipse (photometric phase 0.00 ± 0.05) and outside the eclipse (remaining phases). The top spectrum shows the Hβ line (at 4861 Å) to be slightly stronger (relative to the nearby metallic lines), possibly because of the contribution from the A-type secondary. The secondary is eclipsed in the middle spectrum, which seems to show a better match to the K0III spectrum. Scaling factors have been applied to the three spectra so that the equivalent widths of the metallic lines in the 4900−5000 Å range are the same.
Current usage metrics show cumulative count of Article Views (full-text article views including HTML views, PDF and ePub downloads, according to the available data) and Abstracts Views on Vision4Press platform.
Data correspond to usage on the plateform after 2015. The current usage metrics is available 48-96 hours after online publication and is updated daily on week days.
Initial download of the metrics may take a while.