Fig. 1.
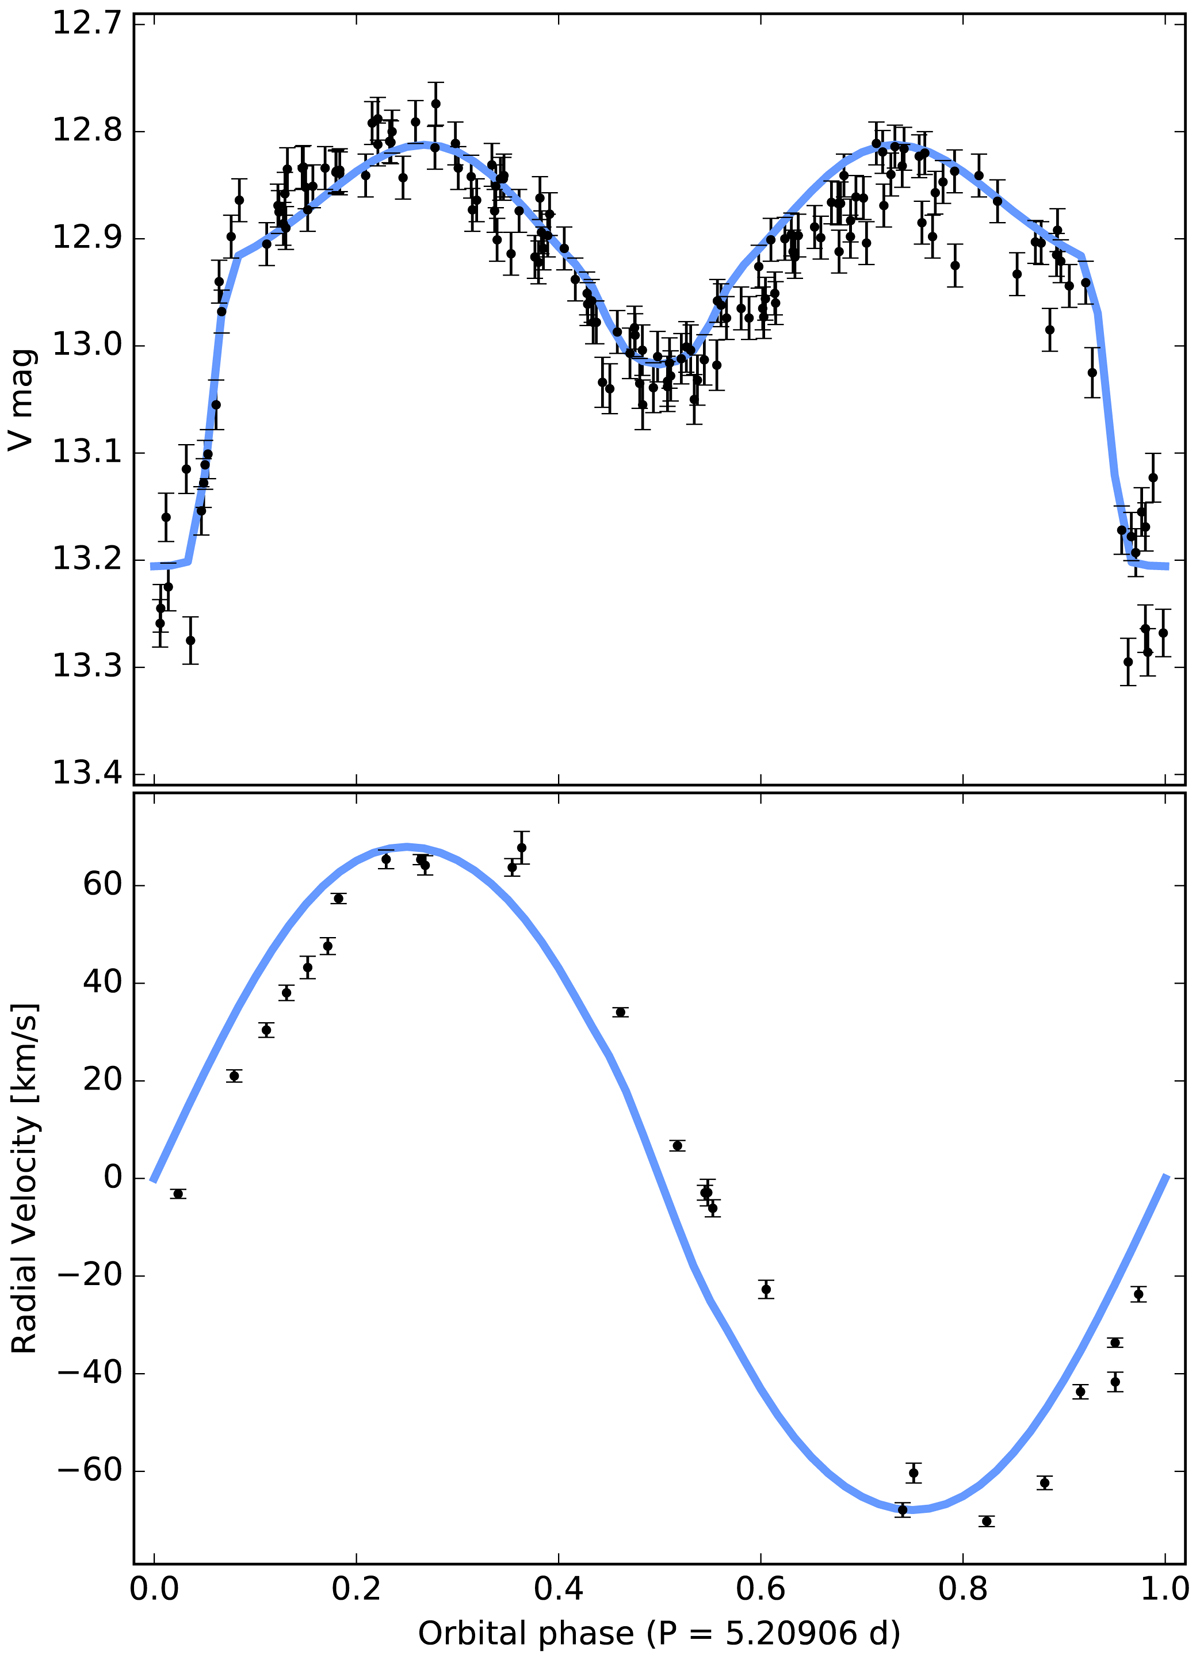
Aperture photometry and radial velocity. Top: ASAS-SN light curve of GS4, folded using the period p = 5.20906 ± 0.0005 d and t0 = 2457384.6 HJD. Bottom: corresponding radial velocity of the system as observed by the LT. We do see a 0.04 phase shift between the radial velocity curve and the ASAS-SN light curve, but we have no clear explanation for it (see Sect. 2.1). The blue curves correspond to the best fit model obtained with PHOEBE on the ASAS-SN light curve when fixing the semi-amplitude radial velocity of the system to the one measured from the LT curve (see Sect. 2.2).
Current usage metrics show cumulative count of Article Views (full-text article views including HTML views, PDF and ePub downloads, according to the available data) and Abstracts Views on Vision4Press platform.
Data correspond to usage on the plateform after 2015. The current usage metrics is available 48-96 hours after online publication and is updated daily on week days.
Initial download of the metrics may take a while.