Free Access
Fig. 6
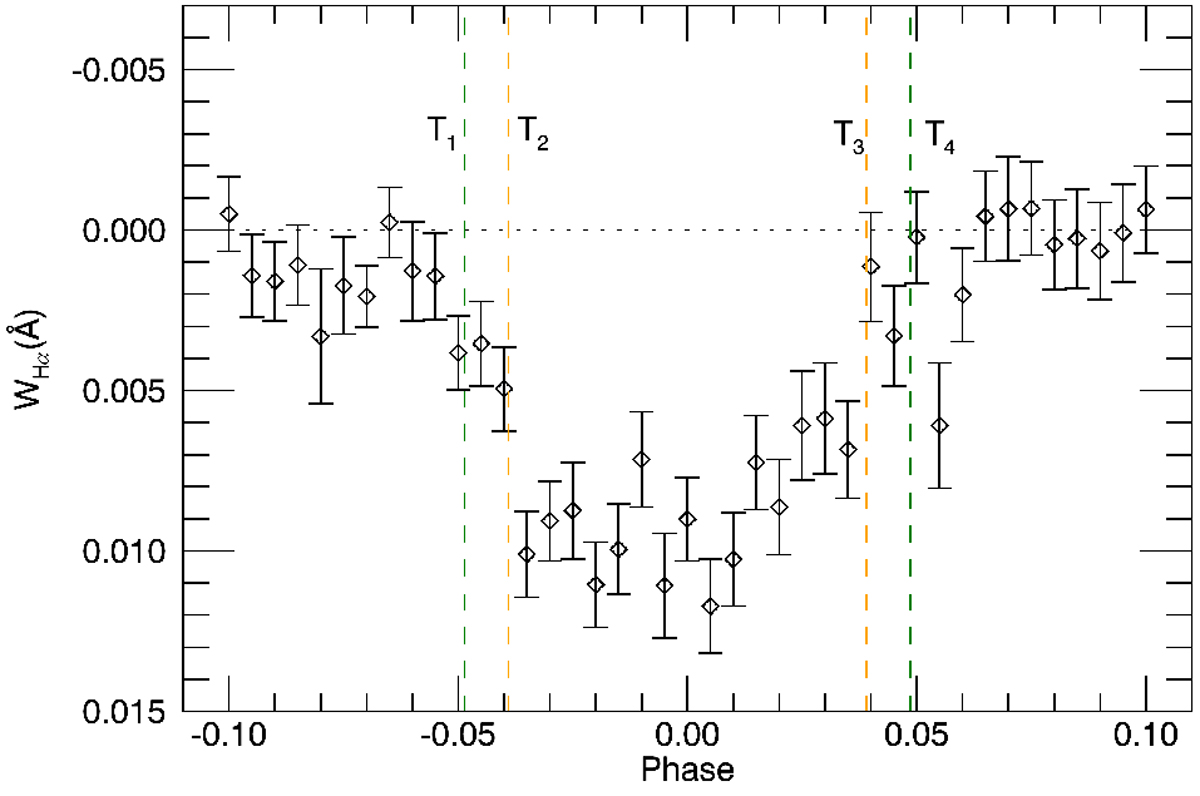
Time series of the Hα equivalent width. The values are measured on the combined transmission spectral matrix in Fig. 5. The vertical dashed lines indicate the first (T1), second (T2), third (T3), and fourth (T4) contacts of the transit. The horizontal line denotes WHα = 0.
Current usage metrics show cumulative count of Article Views (full-text article views including HTML views, PDF and ePub downloads, according to the available data) and Abstracts Views on Vision4Press platform.
Data correspond to usage on the plateform after 2015. The current usage metrics is available 48-96 hours after online publication and is updated daily on week days.
Initial download of the metrics may take a while.