Fig. 2
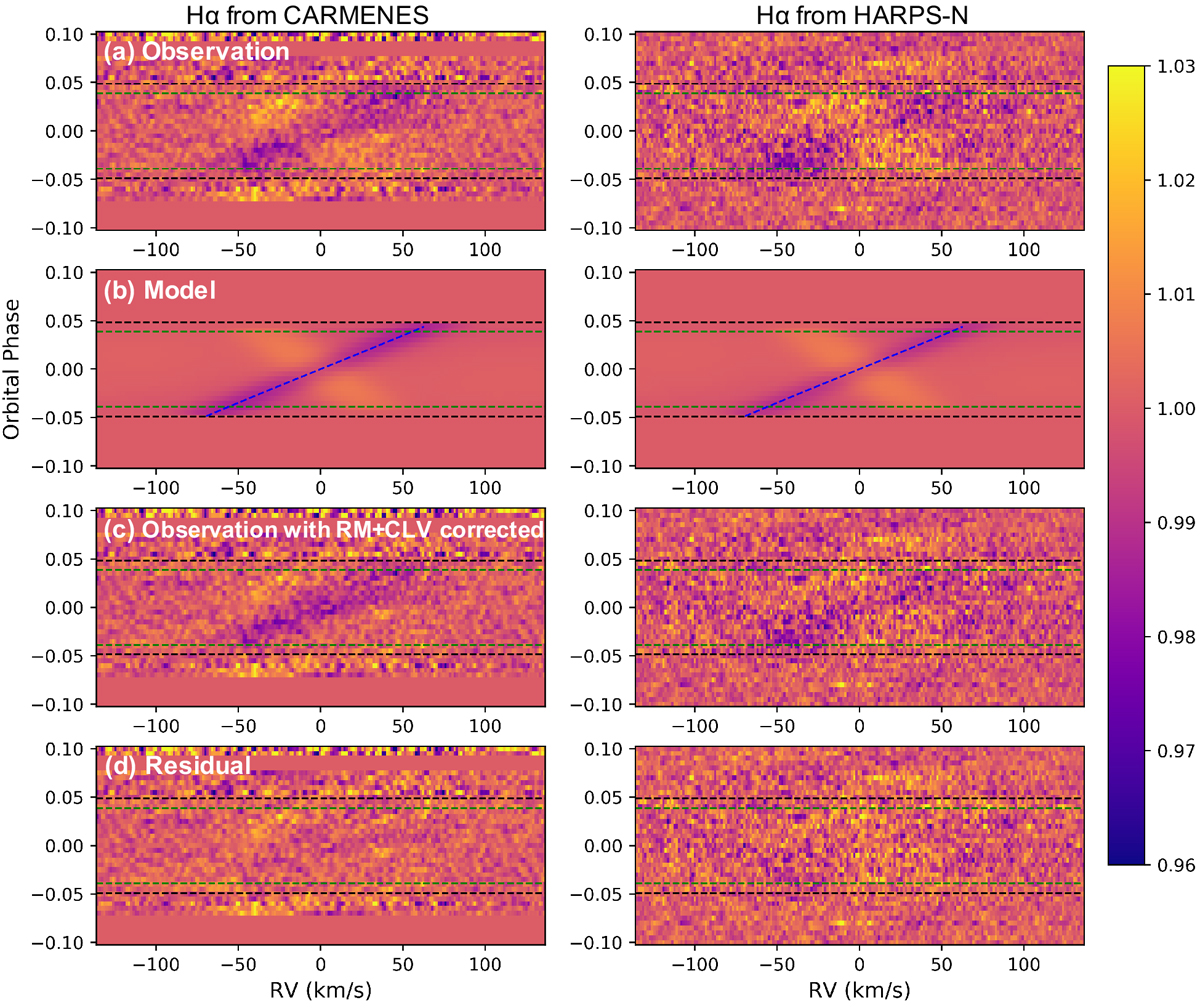
Transmission spectral matrices for the Hα line from the CARMENES observations (left) and the HARPS-N observations (right). The colour bar indicates the value of relative flux. (a) The observed transmission spectra. The x-axis is wavelength expressed in RV relative to the Hα line centre (6562.79 Å) in the stellar rest frame. The horizontal dashed lines indicate the four contacts of transit. (b) The best-fit model from the MCMC analysis. The model includes the Hα transmission spectrum and the stellar line profile change (i.e. the CLV and RM effects). The blue dashed line indicates the RV of the planetary orbital motion plus a constant shift (Vcentre). Although the models extend into the ingress and egress regions on the matrices, the fit was only performed on the fully in-transit data. (c) The observed transmission spectra with the RM and CLV effects corrected. (d) The residual between the observation and the model.
Current usage metrics show cumulative count of Article Views (full-text article views including HTML views, PDF and ePub downloads, according to the available data) and Abstracts Views on Vision4Press platform.
Data correspond to usage on the plateform after 2015. The current usage metrics is available 48-96 hours after online publication and is updated daily on week days.
Initial download of the metrics may take a while.