Fig. C.1.
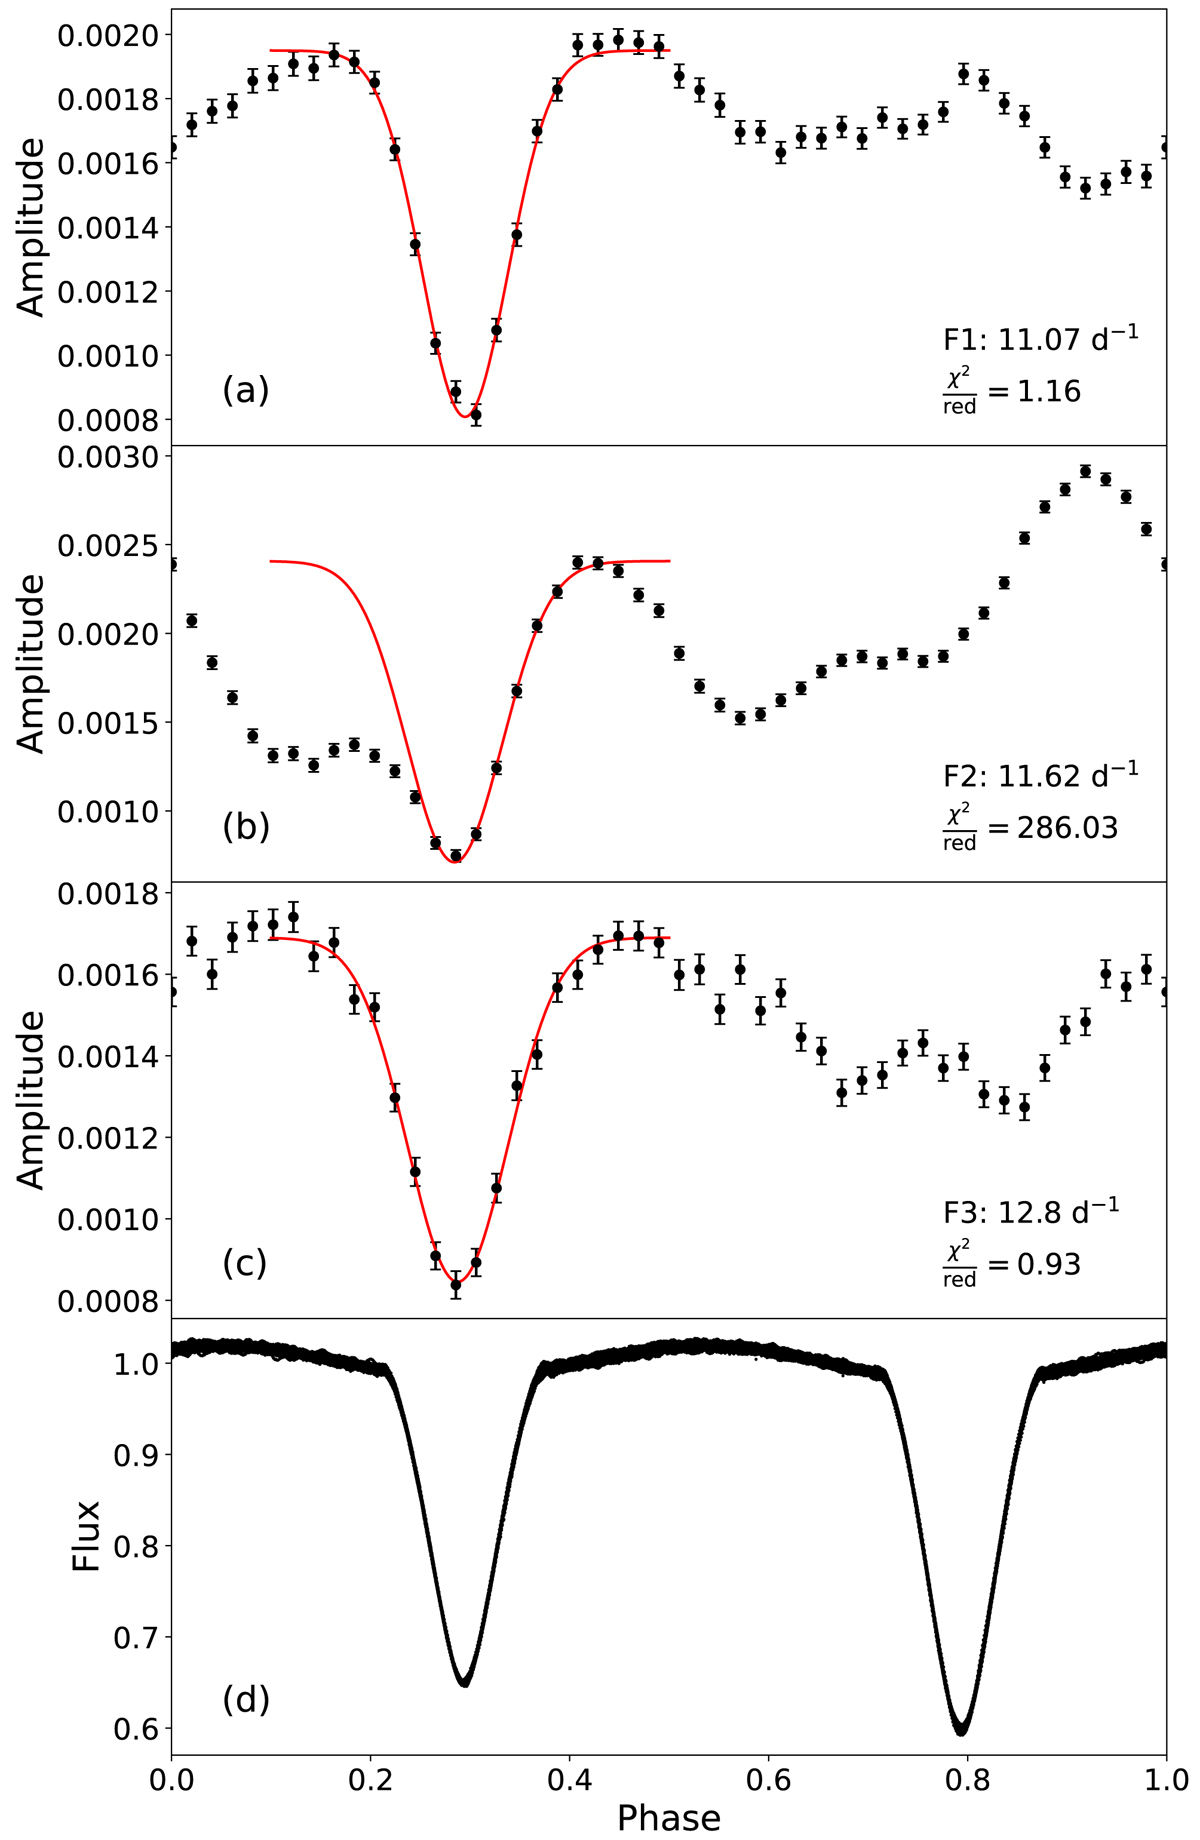
Same as Fig. 7 but including fits of Eq. (C.2) as red lines. The values for the frequencies F1 and F3 have been fitted between the phases 0.1 and 0.5 while the values for F2 have been fitted between 0.25 and 0.45. The reduced chi-square statistic is given in the bottom right of each panel indicating a good fit for F1 and F3.
Current usage metrics show cumulative count of Article Views (full-text article views including HTML views, PDF and ePub downloads, according to the available data) and Abstracts Views on Vision4Press platform.
Data correspond to usage on the plateform after 2015. The current usage metrics is available 48-96 hours after online publication and is updated daily on week days.
Initial download of the metrics may take a while.