Fig. 7.
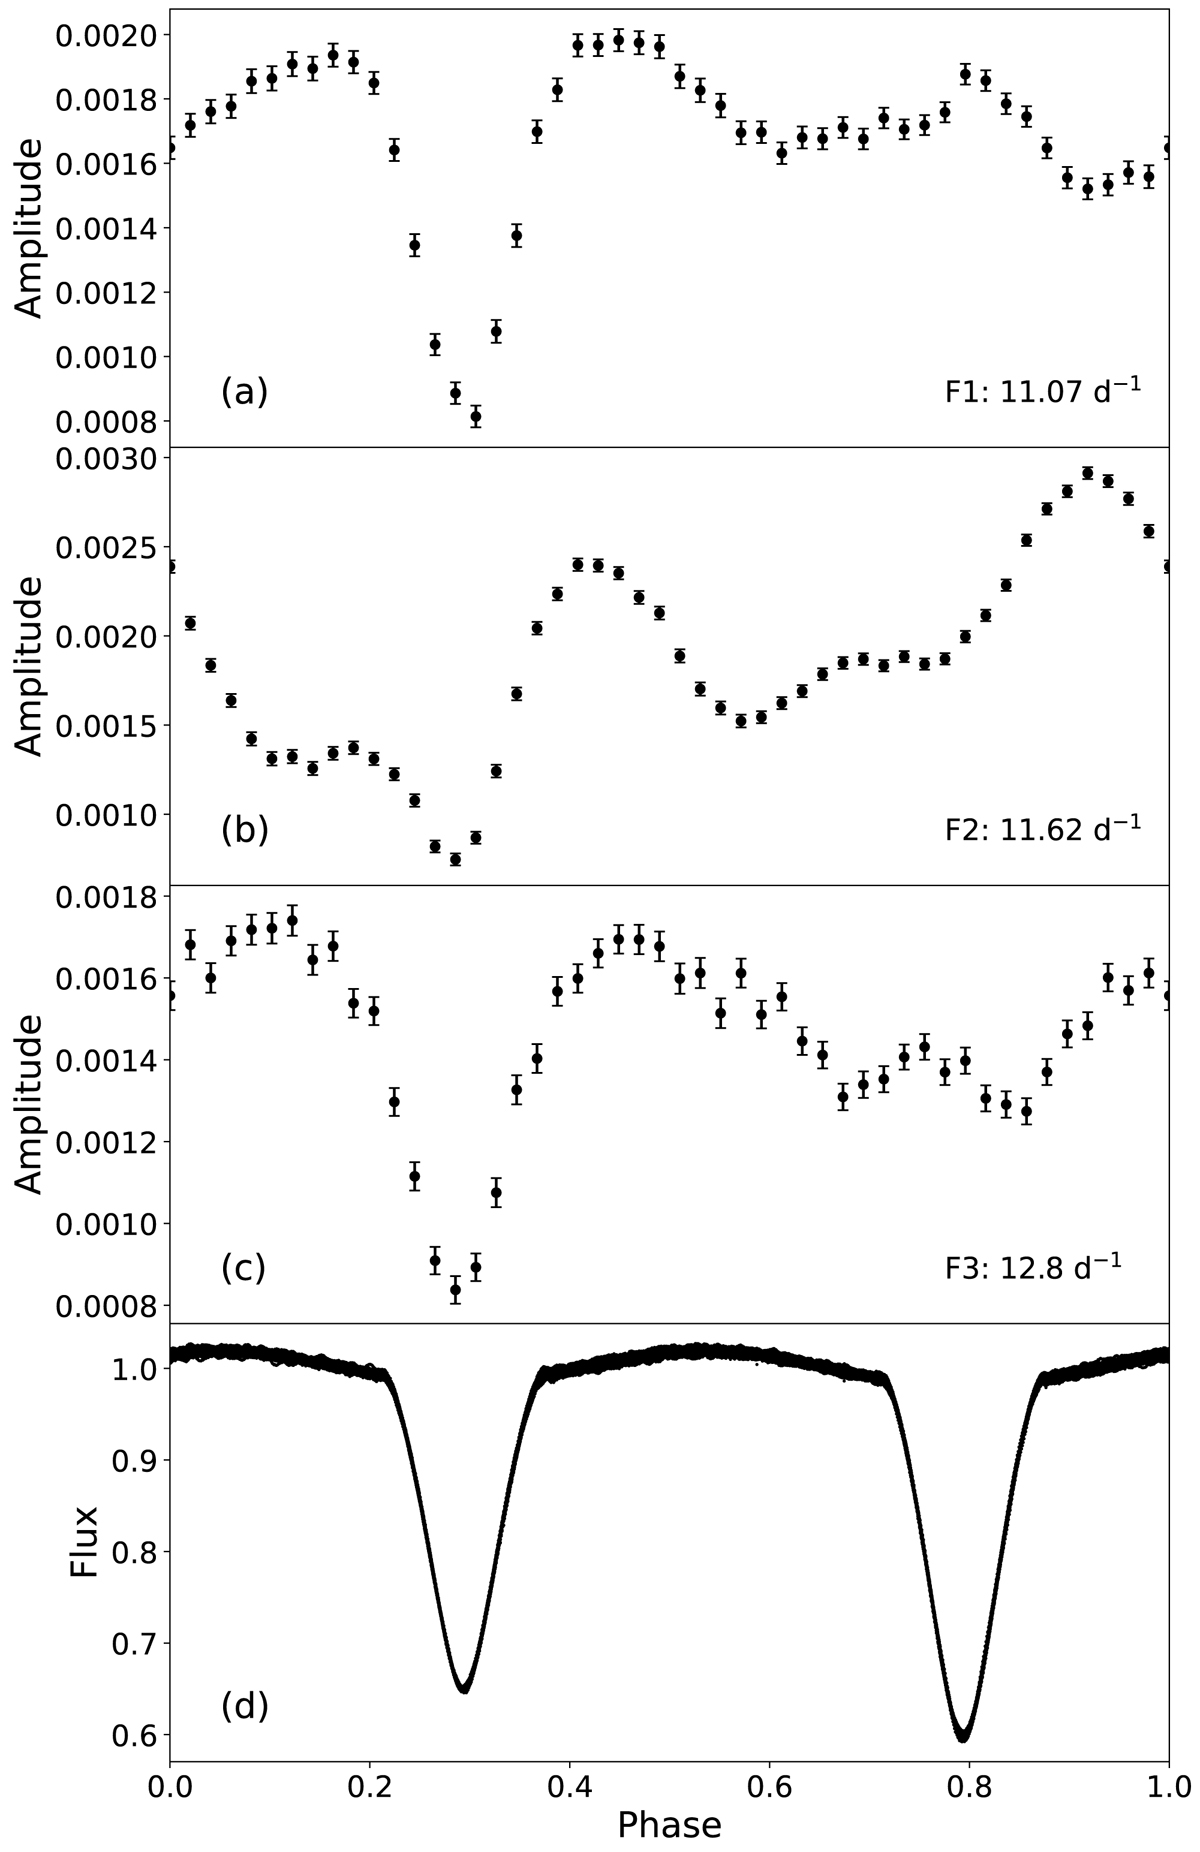
Observed amplitude variations throughout the binary phase. Panels a–c: amplitude of the three frequencies with the highest amplitude in the Lomb-Scargle periodogram as a function of the orbital phase, respectively. See the text for additional explanation how the frequencies were fitted. Panel d: phase folded light curve for comparison.
Current usage metrics show cumulative count of Article Views (full-text article views including HTML views, PDF and ePub downloads, according to the available data) and Abstracts Views on Vision4Press platform.
Data correspond to usage on the plateform after 2015. The current usage metrics is available 48-96 hours after online publication and is updated daily on week days.
Initial download of the metrics may take a while.