Fig. 6.
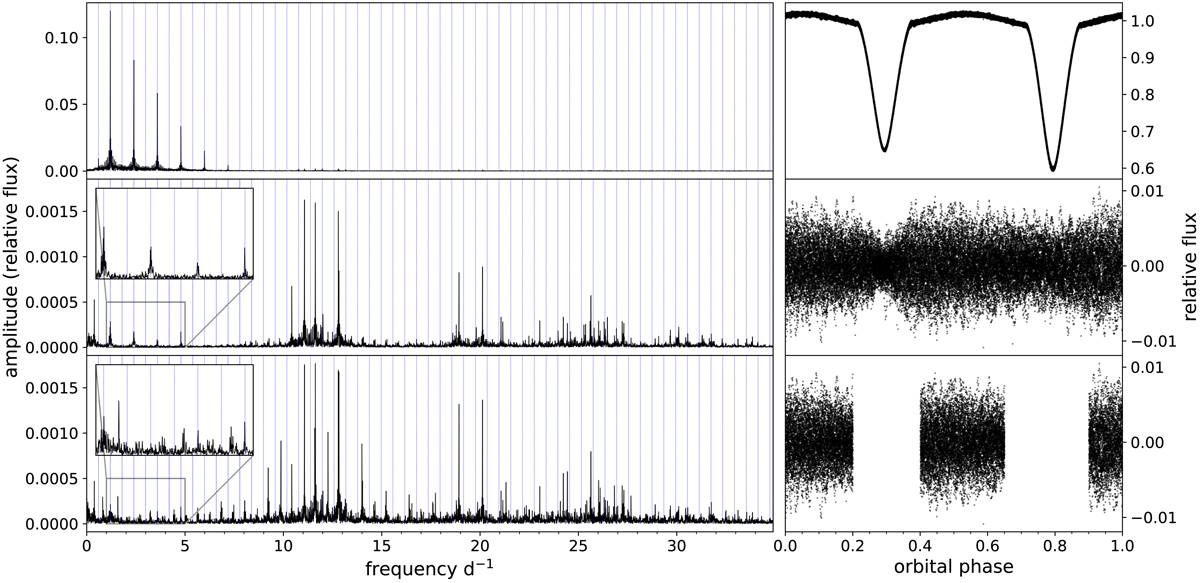
Amplitude spectra and phase folds for different light curves. Top panel: the original light curve. Middle panel: the light curve minus the binary model. Bottom panel: the light curve minus the binary model on the out-of-eclipse phase. The middle and bottom panel have the same scaling in the y-axis while the scaling of the top panel is different.
Current usage metrics show cumulative count of Article Views (full-text article views including HTML views, PDF and ePub downloads, according to the available data) and Abstracts Views on Vision4Press platform.
Data correspond to usage on the plateform after 2015. The current usage metrics is available 48-96 hours after online publication and is updated daily on week days.
Initial download of the metrics may take a while.