Fig. 4.
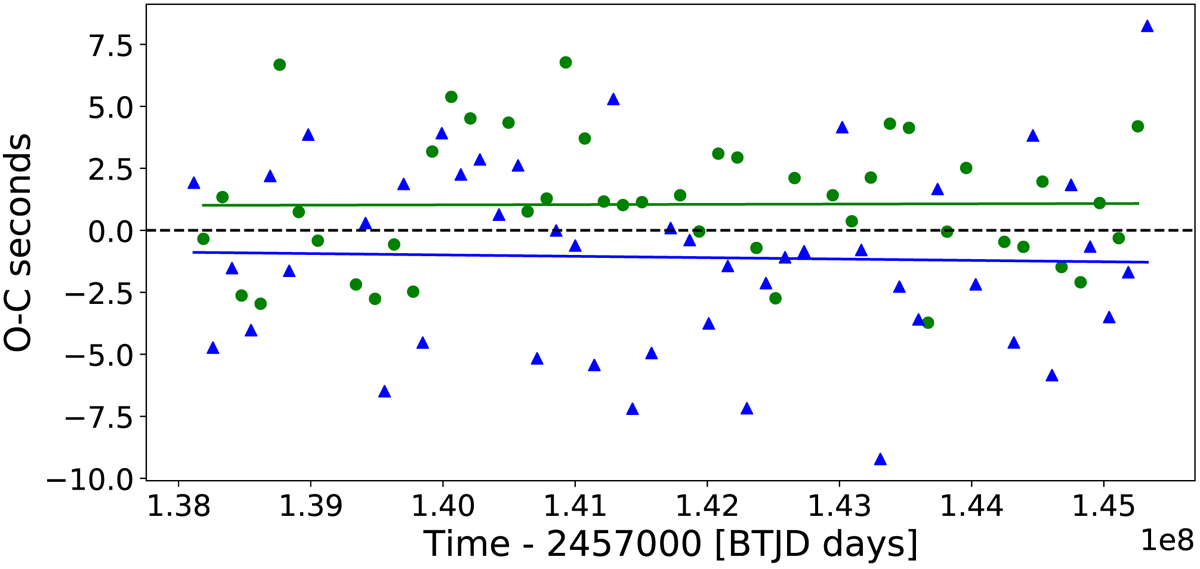
Eclipse timing variations for the light curve after the first iteration. The green circles and blue triangles show the values for the primary and secondary eclipse respectively. Both data were fitted with a straight line. The small offset to the expected values (black dashed line) could indicate a slight non-zero eccentricity.
Current usage metrics show cumulative count of Article Views (full-text article views including HTML views, PDF and ePub downloads, according to the available data) and Abstracts Views on Vision4Press platform.
Data correspond to usage on the plateform after 2015. The current usage metrics is available 48-96 hours after online publication and is updated daily on week days.
Initial download of the metrics may take a while.