Free Access
Fig. 2.
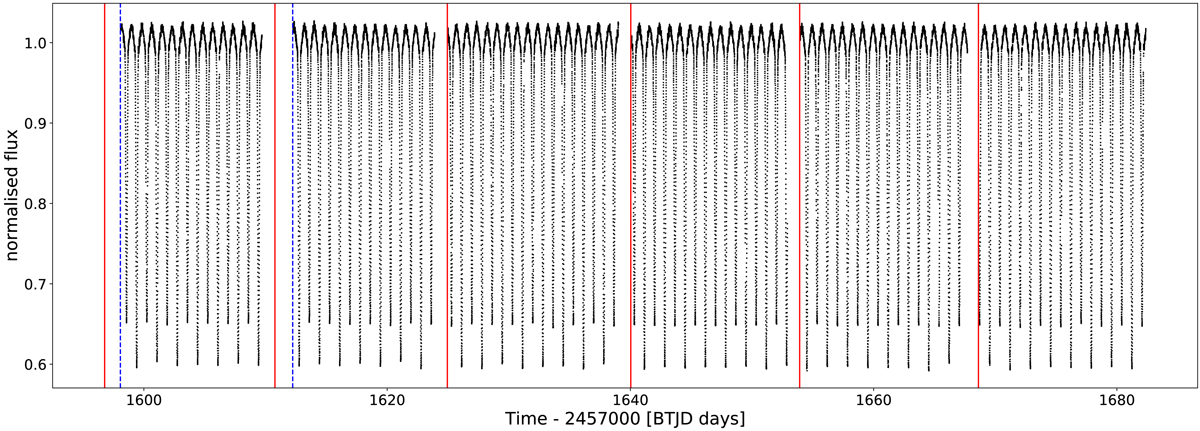
SAP flux light curve of RS Cha as black dots. Vertical red lines mark the start of any Orbits. Orbits 29 and 30 in sector 11 suffered from scattered light signals. The corresponding measurements have been removed by the TESS pipeline. This concerns the times between the start of the orbits and the blue dashed lines.
Current usage metrics show cumulative count of Article Views (full-text article views including HTML views, PDF and ePub downloads, according to the available data) and Abstracts Views on Vision4Press platform.
Data correspond to usage on the plateform after 2015. The current usage metrics is available 48-96 hours after online publication and is updated daily on week days.
Initial download of the metrics may take a while.