Fig. D.1.
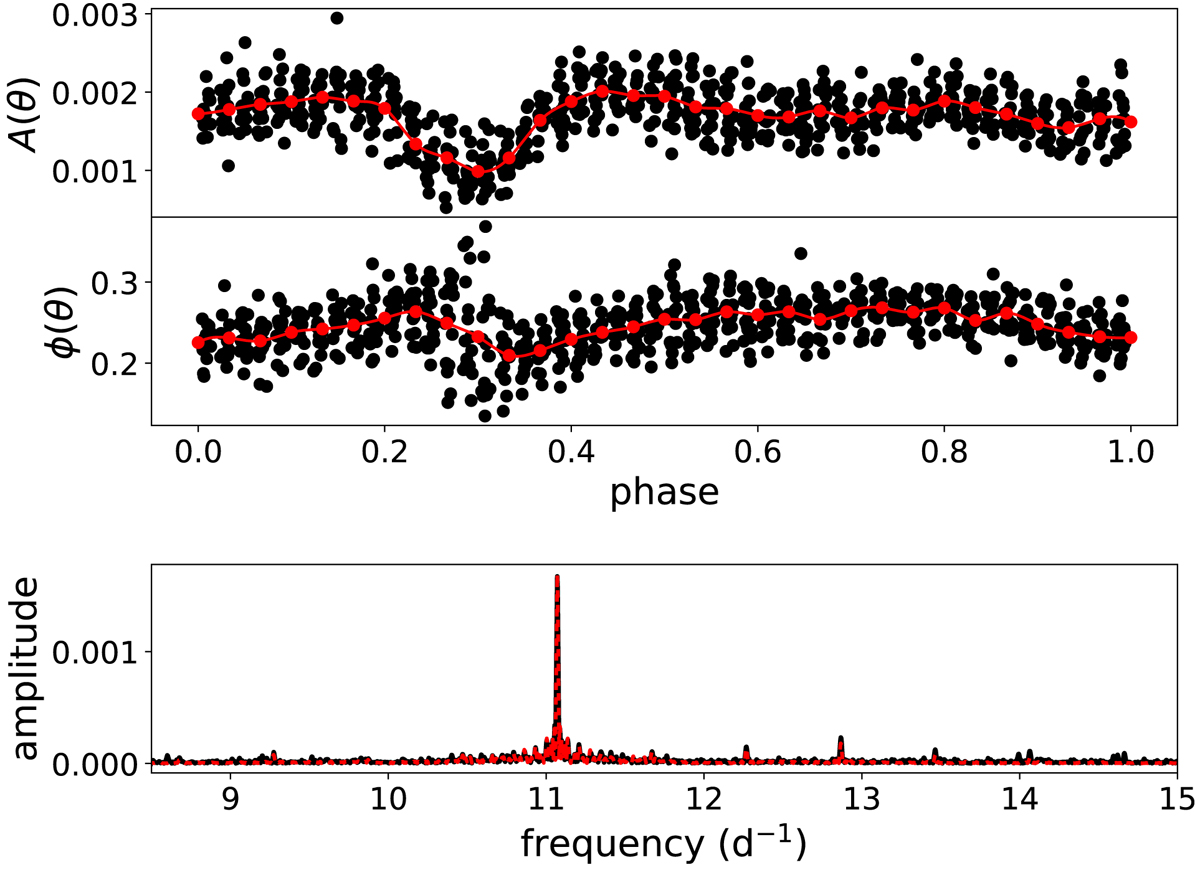
Amplitude and phase variations obtained when assuming the multiplet around F1 is solely due to an individual frequency at F1. Top panel: amplitude variations obtained from fitting F1 to subsets of the multiplet light curve (black points), the binned values (red points), and the cubic spline interpolation used as model (red line). Middle panel: same as the top panel but for phase variations. Bottom panel: amplitude spectra of the multiplet light curve (black line) and of the resulting model flux (dashed red line).
Current usage metrics show cumulative count of Article Views (full-text article views including HTML views, PDF and ePub downloads, according to the available data) and Abstracts Views on Vision4Press platform.
Data correspond to usage on the plateform after 2015. The current usage metrics is available 48-96 hours after online publication and is updated daily on week days.
Initial download of the metrics may take a while.