Fig. C.5.
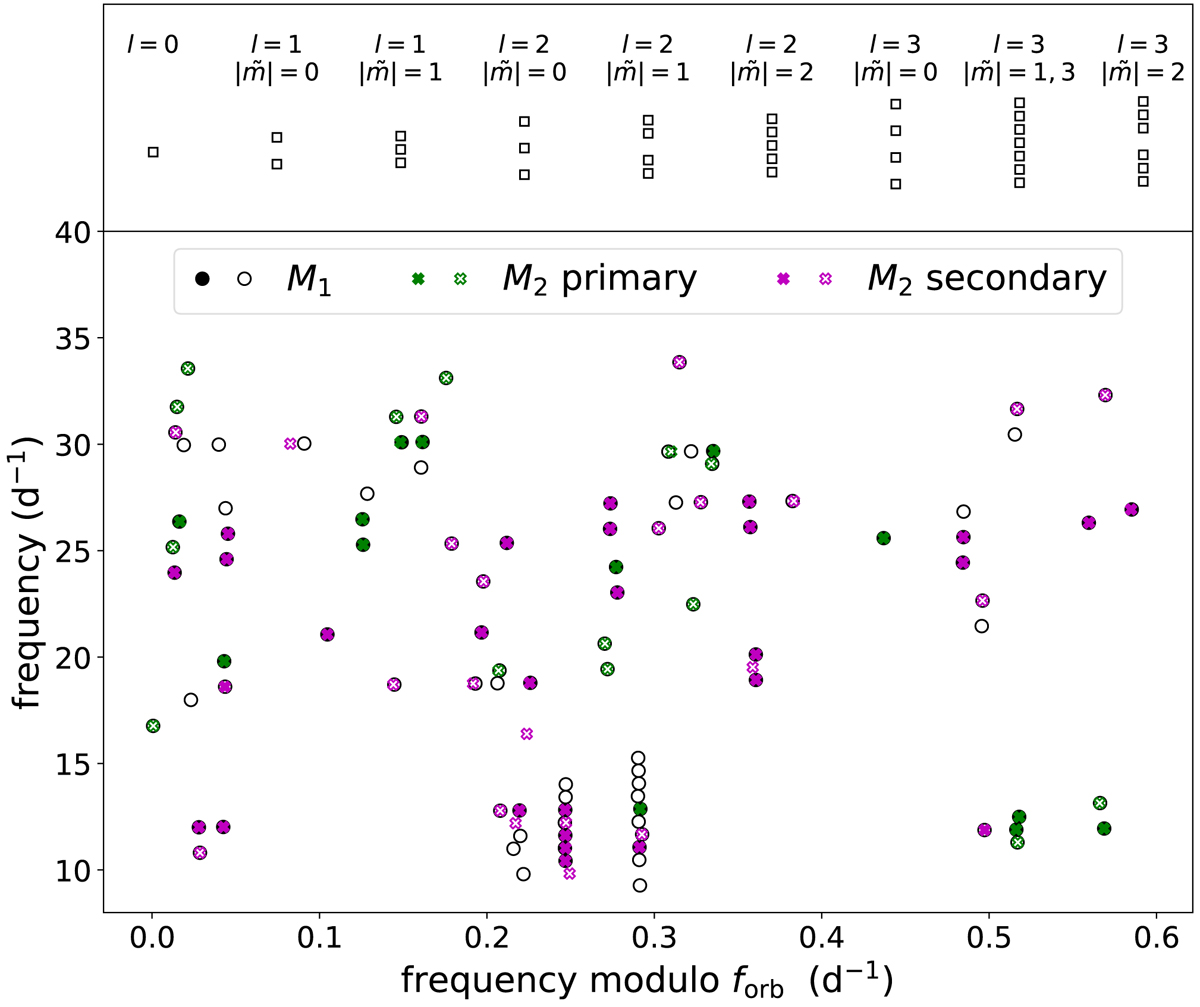
Significant frequencies modulo the orbital frequency to visualise the evidence for tidally perturbed modes. Top panel: the signature of multiplets expected from the theory of perturbed pulsation corresponding to different values of l and ![]() . Multiplets are plotted according to the tables in Smeyers (2005) and Balona (2018). Bottom panel: All significant frequencies from the traditional model and our toy model above 8 d−1 modulo the orbital frequency. Frequencies from he traditional model are shown as black circles were filled circles indicate the frequencies with amplitudes above 165 ppm and open circles frequencies below that amplitude level. Frequencies from our toy model are shown as coloured crosses: green crosses correspond to frequencies assigned to the primary component while magenta crosses correspond to frequencies assigned to the secondary component. Low amplitude modes are depicted as open crosses.
. Multiplets are plotted according to the tables in Smeyers (2005) and Balona (2018). Bottom panel: All significant frequencies from the traditional model and our toy model above 8 d−1 modulo the orbital frequency. Frequencies from he traditional model are shown as black circles were filled circles indicate the frequencies with amplitudes above 165 ppm and open circles frequencies below that amplitude level. Frequencies from our toy model are shown as coloured crosses: green crosses correspond to frequencies assigned to the primary component while magenta crosses correspond to frequencies assigned to the secondary component. Low amplitude modes are depicted as open crosses.
Current usage metrics show cumulative count of Article Views (full-text article views including HTML views, PDF and ePub downloads, according to the available data) and Abstracts Views on Vision4Press platform.
Data correspond to usage on the plateform after 2015. The current usage metrics is available 48-96 hours after online publication and is updated daily on week days.
Initial download of the metrics may take a while.