Free Access
Fig. C.3.
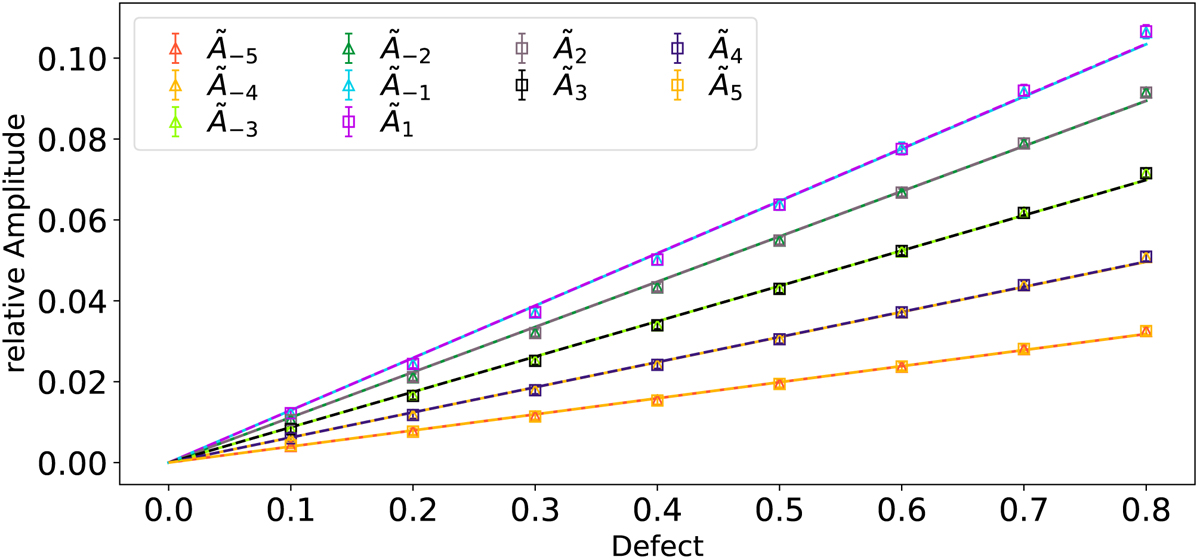
Relative amplitude of the side peaks as a function of the defect where different colours correspond to different side peaks as given by the legend. The uncertainties are typically the size of the markers. Lines correspond to linear fits that agree within 2σ with a reduced chi-squared statistics of 1 for all fits.
Current usage metrics show cumulative count of Article Views (full-text article views including HTML views, PDF and ePub downloads, according to the available data) and Abstracts Views on Vision4Press platform.
Data correspond to usage on the plateform after 2015. The current usage metrics is available 48-96 hours after online publication and is updated daily on week days.
Initial download of the metrics may take a while.