Fig. C.2.
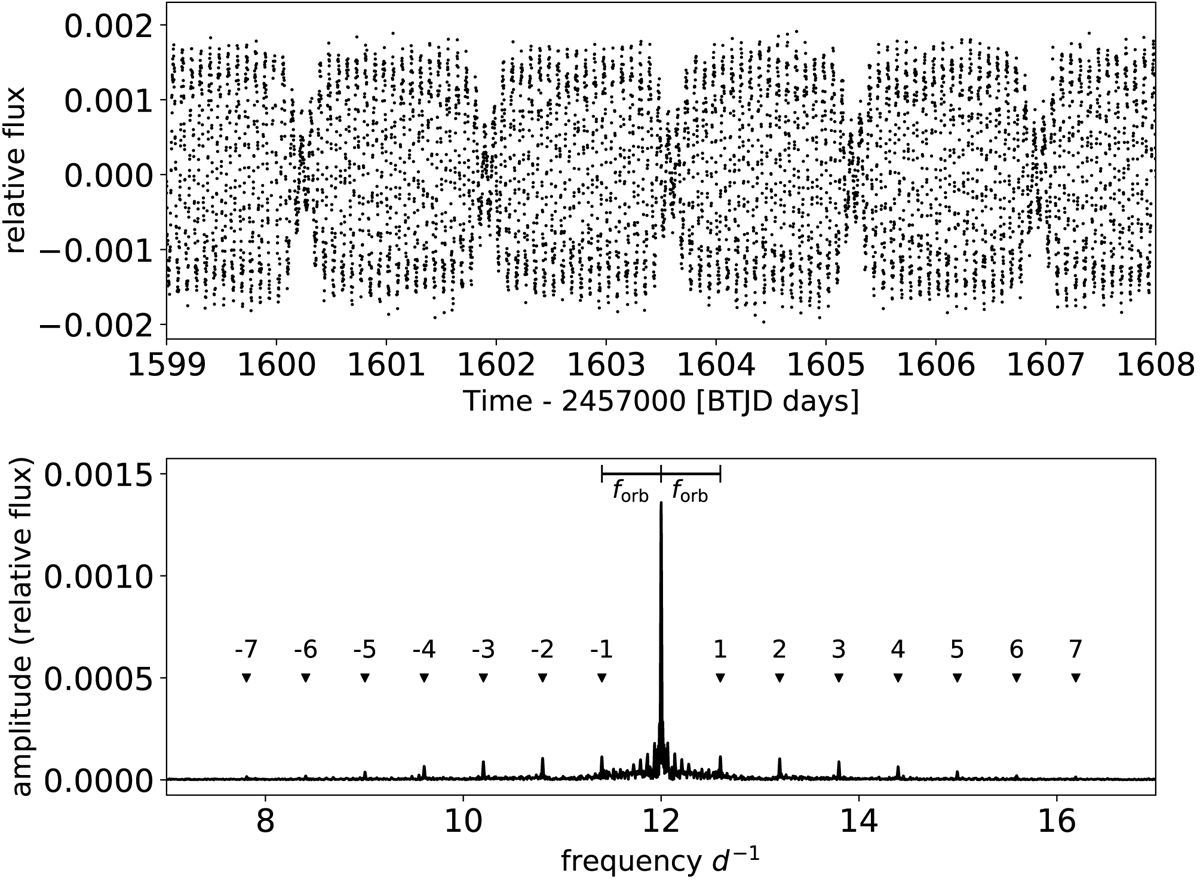
Example light curve built from the toy model. Top panel: simulated light curve for one frequency originating from the secondary component. Bottom panel: amplitude spectra of the light curve in the top panel. Side-frequencies are marked with a triangle and annotated with the number of orbital frequencies that they are shifted with. The errorbars on top show the extend of one orbital frequency.
Current usage metrics show cumulative count of Article Views (full-text article views including HTML views, PDF and ePub downloads, according to the available data) and Abstracts Views on Vision4Press platform.
Data correspond to usage on the plateform after 2015. The current usage metrics is available 48-96 hours after online publication and is updated daily on week days.
Initial download of the metrics may take a while.