Fig. 1.
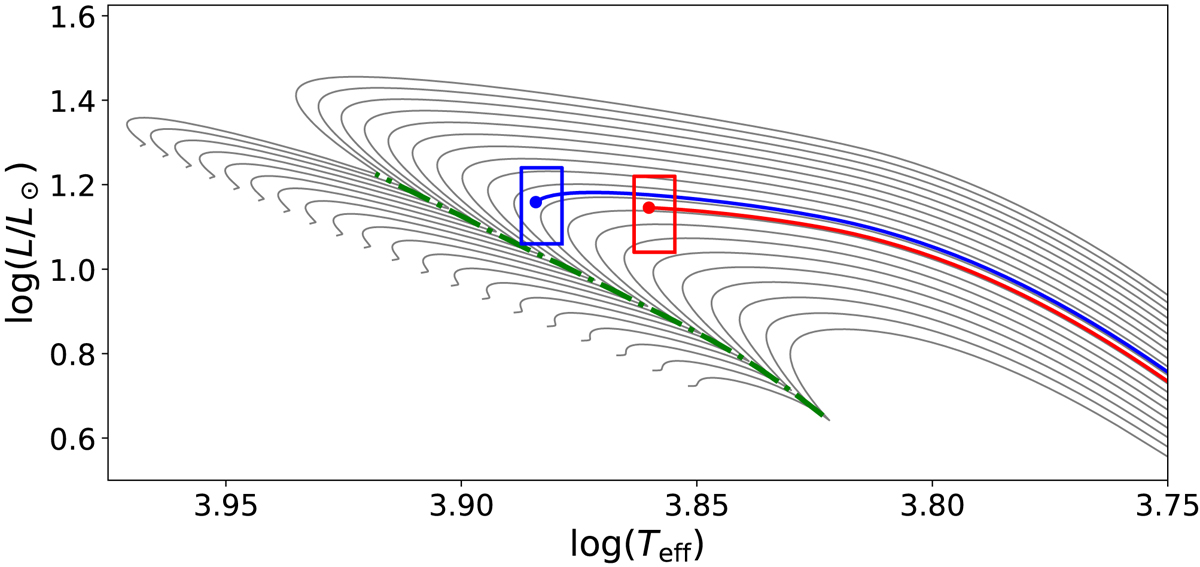
Evolutionary status of the components of RS Cha in a Hertzsprung-Russell diagram. The grey lines show the evolutionary tracks of 1.6 M⊙–2.0 M⊙ stars towards the end of their pre-main sequence phase. The blue and red box shows the observational constraints for the primary and secondary respectively. Also shown are evolutionary tracks corresponding to masses reported by Alecian et al. (2005) that reproduce the observed radius at their final point (marked with a dot) for the primary (blue) and secondary (red). The green dash-dotted line marks the point of evolution where the central C12 mass fraction drops below 10−4.
Current usage metrics show cumulative count of Article Views (full-text article views including HTML views, PDF and ePub downloads, according to the available data) and Abstracts Views on Vision4Press platform.
Data correspond to usage on the plateform after 2015. The current usage metrics is available 48-96 hours after online publication and is updated daily on week days.
Initial download of the metrics may take a while.