Fig. 9.
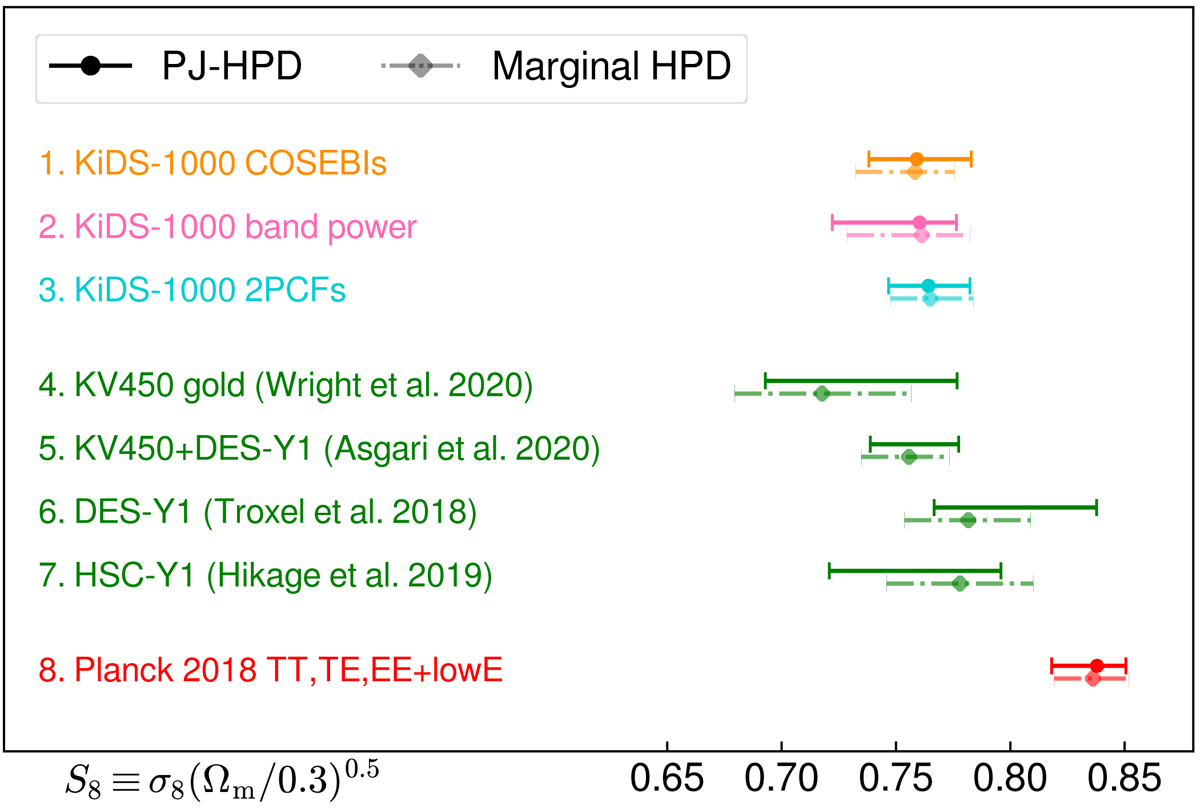
Comparison between S8 values for different surveys. All results are shown for both multivariate maximum posterior (MAP) and PJ-HPD (upper solid bar), as well as the marginal mode and the marginal S8 credible interval (lower dot-dashed bar). The top three points show our fiducial KiDS-1000 results. The next four show a selection of recent cosmic shear analyses from external data as well as previous KiDS data releases. We note that S8 does not fully capture the degeneracy direction for all of the analysis above (see the discussion in Sect. 4.1 and Appendix A). For example for the HSC-Y1 contours α = 0.45 was found to be the best fitting power. The last entry shows the Planck 2018 (TT, TE, EE+lowE) constraints. An extended version of this plot can be found in Appendix A.
Current usage metrics show cumulative count of Article Views (full-text article views including HTML views, PDF and ePub downloads, according to the available data) and Abstracts Views on Vision4Press platform.
Data correspond to usage on the plateform after 2015. The current usage metrics is available 48-96 hours after online publication and is updated daily on week days.
Initial download of the metrics may take a while.