Fig. 8.
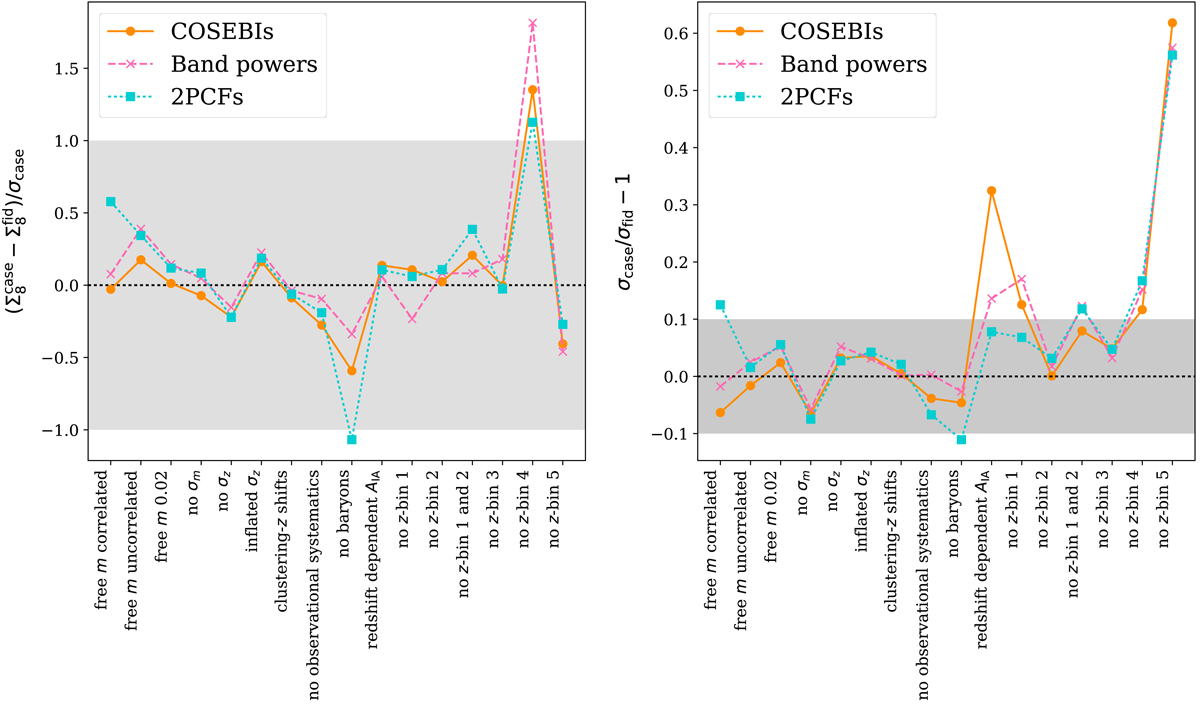
Relative impact of nuisance parameters and the removal of redshift bins. Each of the cases explored in Fig. 7 is compared to their corresponding fiducial results. COSEBIs are shown as orange circles, band powers as pink crosses and 2PCFs as cyan squares. Left: the difference between the upper edge of the marginal Σ8 posterior for each case and its fiducial chain, normalised by half of the length of the marginal credible interval of the case. The grey shaded area indicates the region in which systematic shifts remain below the 1σ statistical error. Right: comparison of constraining power between the fiducial and the other cases. Here α is fitted to each chain separately to find the tightest Σ8 = σ8(Ωm/0.3)α constraint for each case. We show the fractional difference between the standard deviations of the case and the fiducial one.
Current usage metrics show cumulative count of Article Views (full-text article views including HTML views, PDF and ePub downloads, according to the available data) and Abstracts Views on Vision4Press platform.
Data correspond to usage on the plateform after 2015. The current usage metrics is available 48-96 hours after online publication and is updated daily on week days.
Initial download of the metrics may take a while.