Fig. 7.
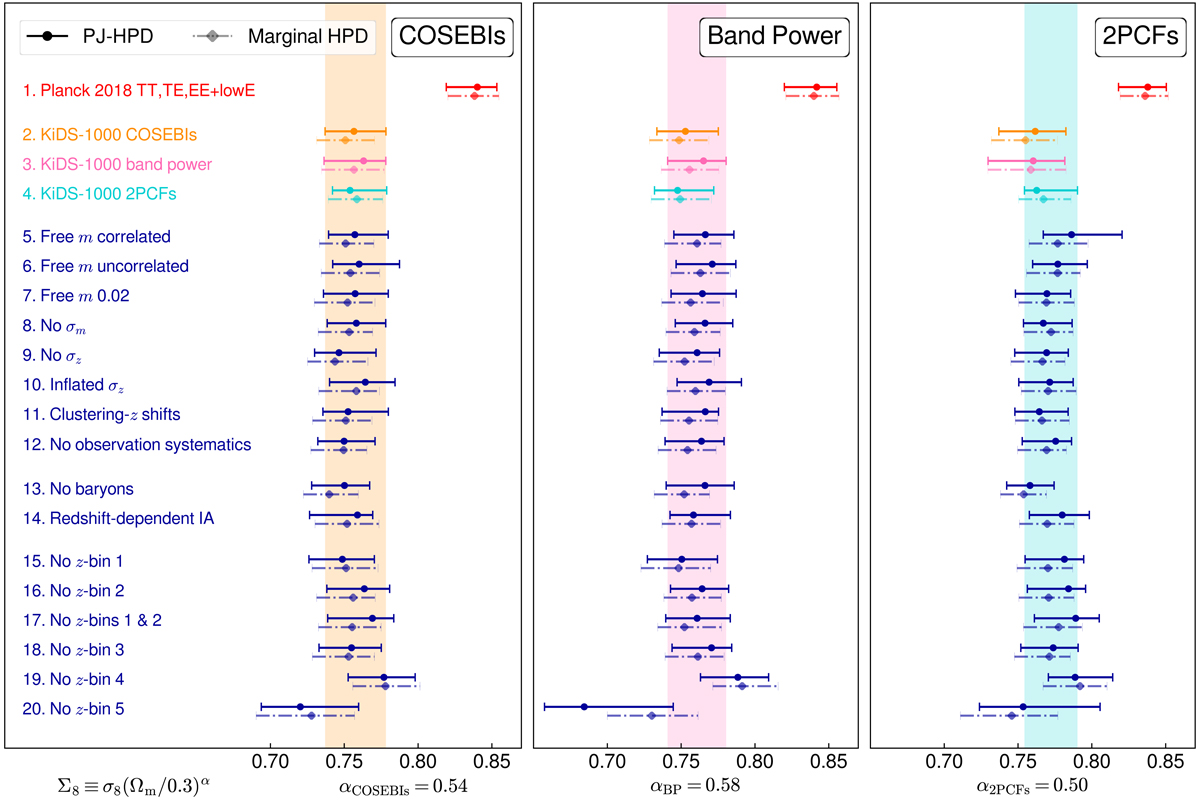
Impact of nuisance parameter treatment and tomographic bin exclusion on Σ8 constraints. Results are shown for COSEBIs (left), band powers (centre) and 2PCFs (right), with fiducial constraints in orange, pink, and cyan, respectively. We use the best-fitting value of α for the fiducial chain of each set of statistics to define Σ8 (Eq. (14)) using the covariance matrix generated from the Tröster et al. (2020a) values instead of the iterative covariance used in Sect. 4.1. The value of α for each panel is given underneath. Two sets of credible regions are shown for each case: the multivariate maximum posterior (MAP, circle) with PJ-HPD (solid) credible interval and the maximum of the Σ8 marginal posterior (diamond) with its highest density credible interval (dot-dashed). The shaded regions follow the fiducial PJ-HPD results of the corresponding statistics. We show Planck results (red), as well as the fiducial results of the other two statistics for the given α of each panel for comparison. Cases 5–12 show the impact of different observational systematics, while cases 13 and 14 show results for the impact of astrophysical systematics. The last six cases present the effect of removing redshift bins and their cross-correlations from the analysis.
Current usage metrics show cumulative count of Article Views (full-text article views including HTML views, PDF and ePub downloads, according to the available data) and Abstracts Views on Vision4Press platform.
Data correspond to usage on the plateform after 2015. The current usage metrics is available 48-96 hours after online publication and is updated daily on week days.
Initial download of the metrics may take a while.