Fig. 3.
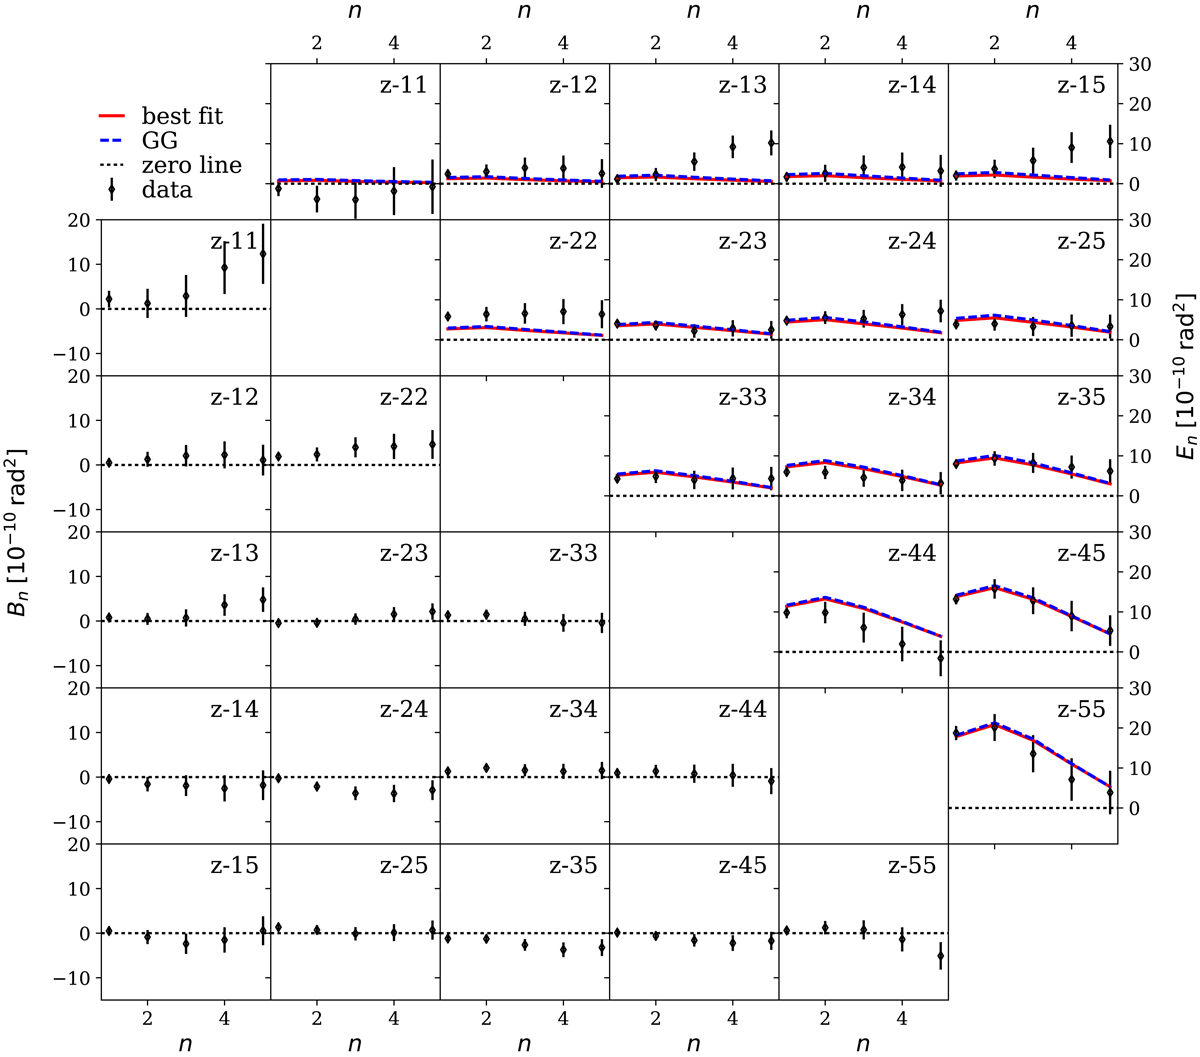
COSEBI measurements and their best fitting model (see Table A.2). We show the best-fitting theoretical prediction with a red curve (![]() ) and the gravitational lensing (GG) contribution with a blue dashed curve. A zero line is shown for reference (black dotted). The E-modes are shown in the top triangle, while the B-modes are shown in the bottom one. The predicted B-mode signal is zero. We use the first five COSEBI E-modes in this analysis, as shown here. With the labels z − ij we show that redshift bins i and j are used for the corresponding panel. The COSEBIs modes are significantly correlated (see Fig. B.1), such that their goodness-of-fit cannot be established by eye.
) and the gravitational lensing (GG) contribution with a blue dashed curve. A zero line is shown for reference (black dotted). The E-modes are shown in the top triangle, while the B-modes are shown in the bottom one. The predicted B-mode signal is zero. We use the first five COSEBI E-modes in this analysis, as shown here. With the labels z − ij we show that redshift bins i and j are used for the corresponding panel. The COSEBIs modes are significantly correlated (see Fig. B.1), such that their goodness-of-fit cannot be established by eye.
Current usage metrics show cumulative count of Article Views (full-text article views including HTML views, PDF and ePub downloads, according to the available data) and Abstracts Views on Vision4Press platform.
Data correspond to usage on the plateform after 2015. The current usage metrics is available 48-96 hours after online publication and is updated daily on week days.
Initial download of the metrics may take a while.