Fig. B.5.
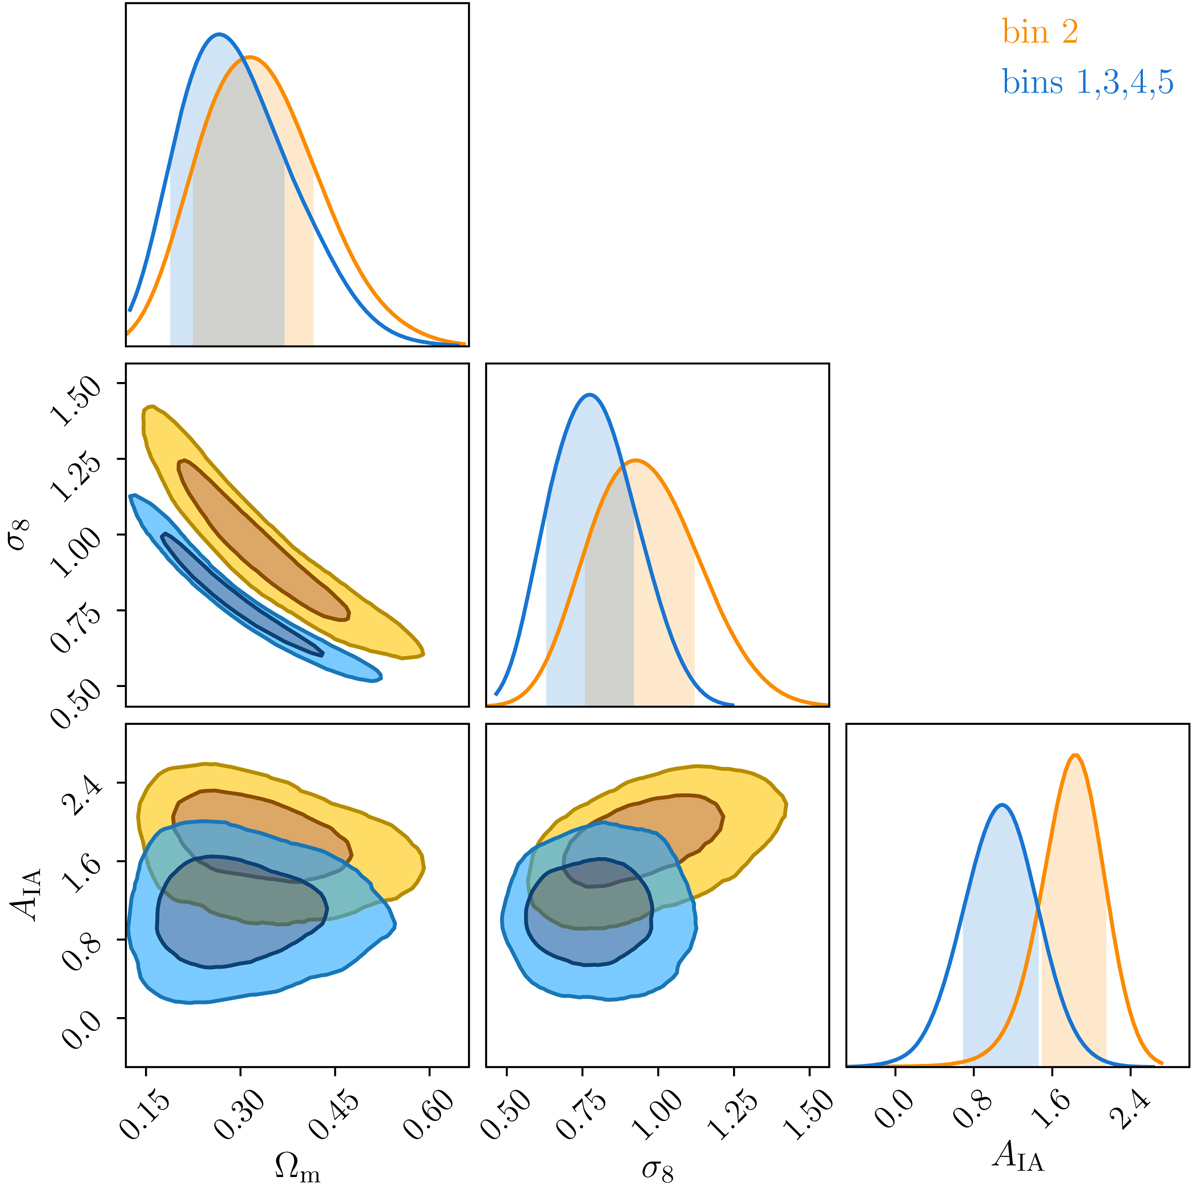
Marginal posteriors using band powers in the internal consistency test that isolates all bin combinations involving the second tomographic bin. The test duplicates the sampling parameters (with fixed δz) and assigns them to the two parts of the data vector. The orange contours refer to the split including the second bin and all its cross-correlations, while the blue ones present the constraints from the remainder of the redshift bins (and their cross-correlations). The cross-covariance between the two parts of the data are included via the data covariance matrix. Other divisions of the data show much more consistent results.
Current usage metrics show cumulative count of Article Views (full-text article views including HTML views, PDF and ePub downloads, according to the available data) and Abstracts Views on Vision4Press platform.
Data correspond to usage on the plateform after 2015. The current usage metrics is available 48-96 hours after online publication and is updated daily on week days.
Initial download of the metrics may take a while.