Fig. B.4.
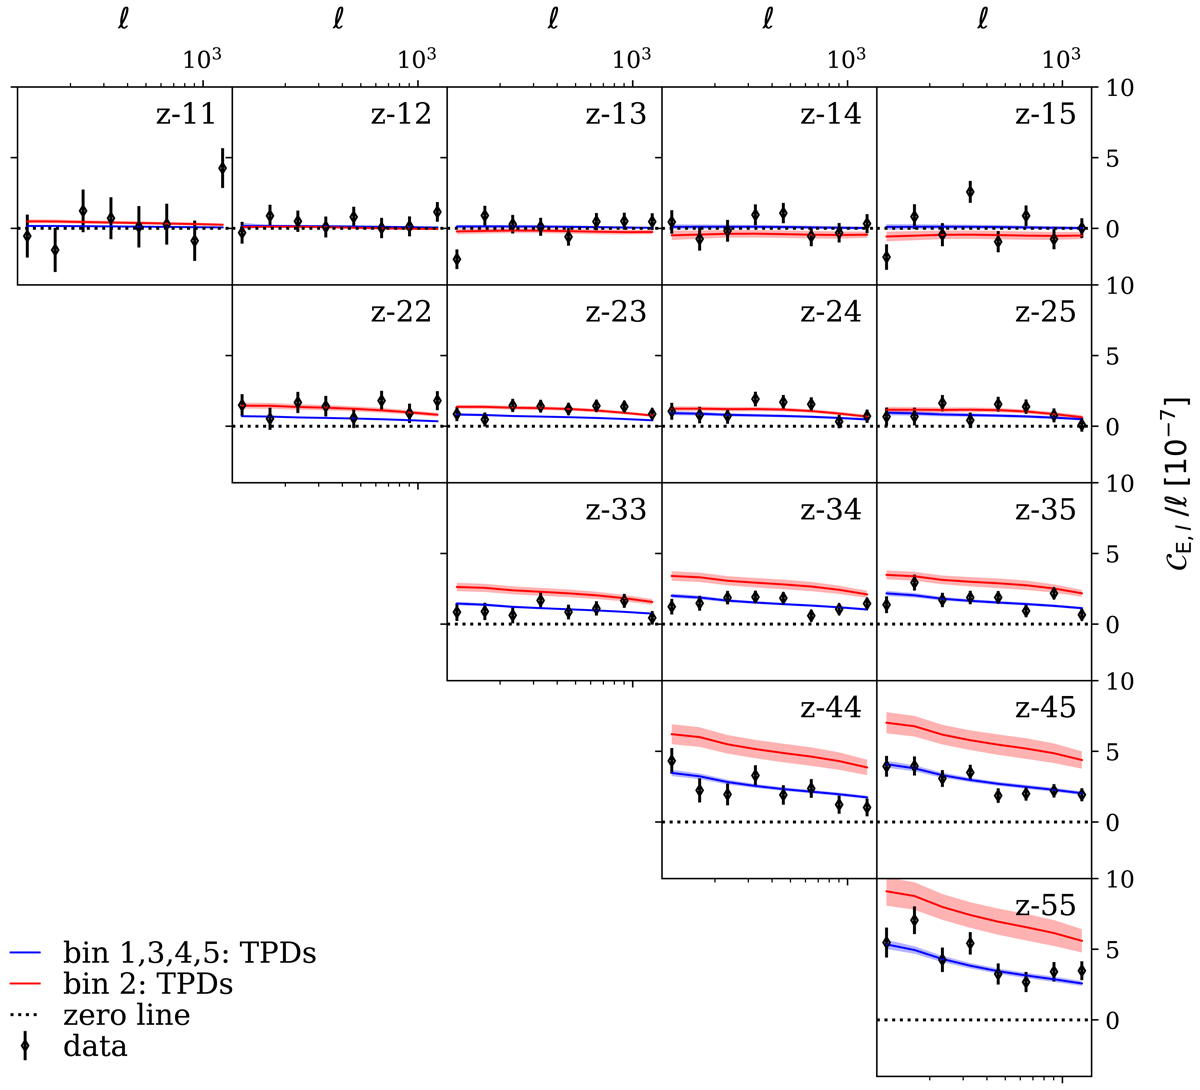
Band power data compared to the best-fit model from the internal consistency test that isolates all bin combinations involving the second tomographic bin. The red curves show the translated posterior distributions (TPDs) resulting from the second bin and its cross-correlations. The blue curves are the TPDs derived from the remainder of the tomographic bins and their combinations. The shaded bands around the curves show their standard deviations.
Current usage metrics show cumulative count of Article Views (full-text article views including HTML views, PDF and ePub downloads, according to the available data) and Abstracts Views on Vision4Press platform.
Data correspond to usage on the plateform after 2015. The current usage metrics is available 48-96 hours after online publication and is updated daily on week days.
Initial download of the metrics may take a while.