Fig. B.3.
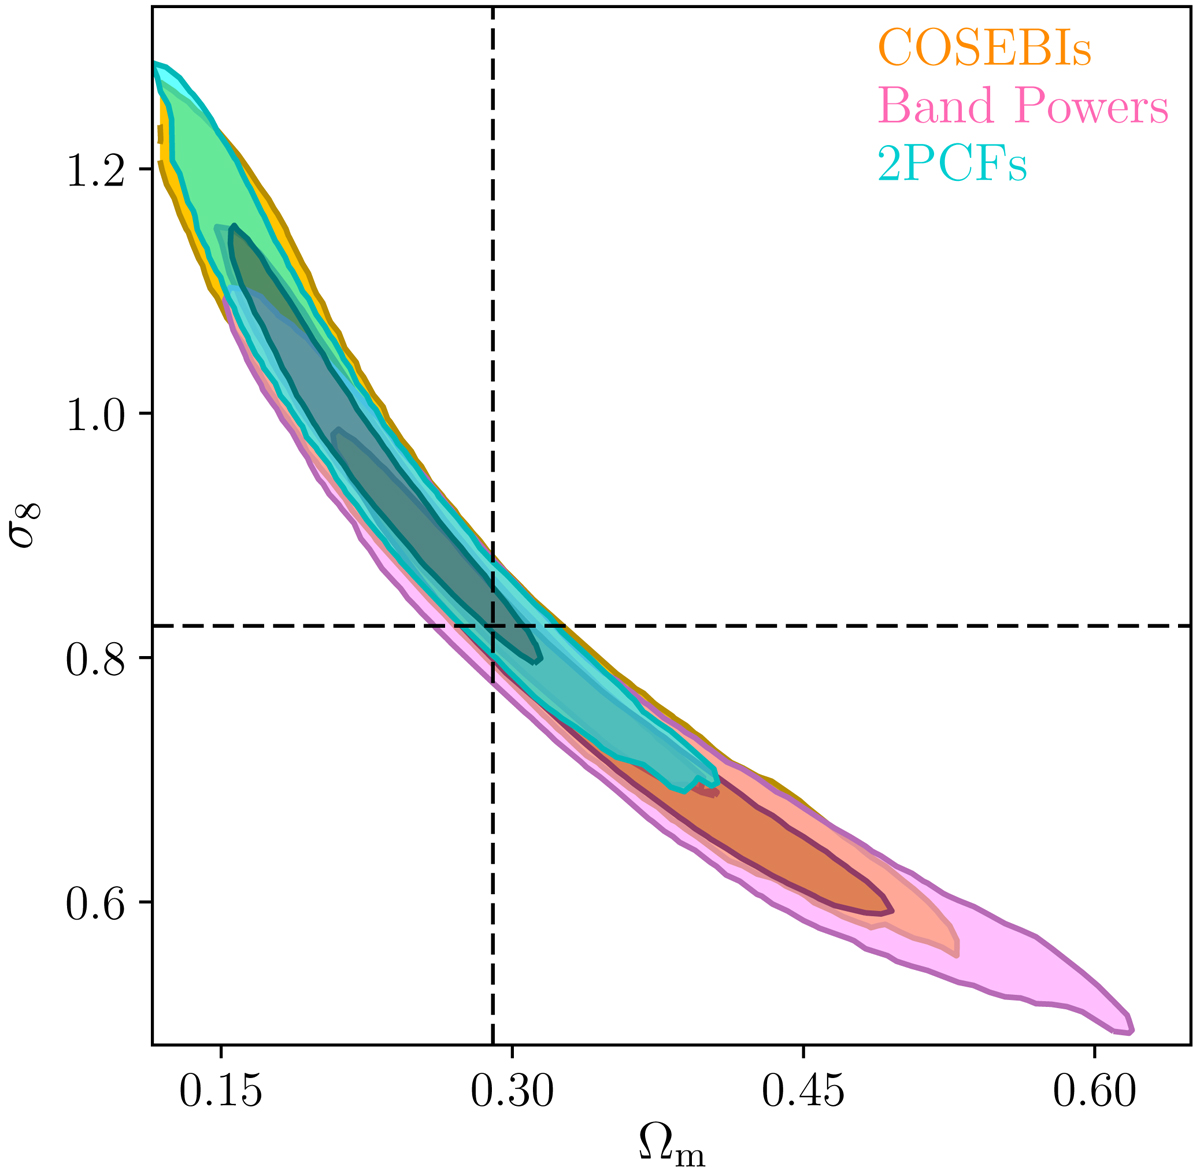
Marginal posterior from mock data displaying a similar degeneracy to the real KiDS-1000 data (compare with Fig. 6). The input values for σ8 and Ωm are shown with the dashed lines. These are results for one of the 100 mock realisations that we analysed. In the same set of realisations we find a number of similar results, with shortened contours for one or more of the statistics.
Current usage metrics show cumulative count of Article Views (full-text article views including HTML views, PDF and ePub downloads, according to the available data) and Abstracts Views on Vision4Press platform.
Data correspond to usage on the plateform after 2015. The current usage metrics is available 48-96 hours after online publication and is updated daily on week days.
Initial download of the metrics may take a while.