Fig. B.2.
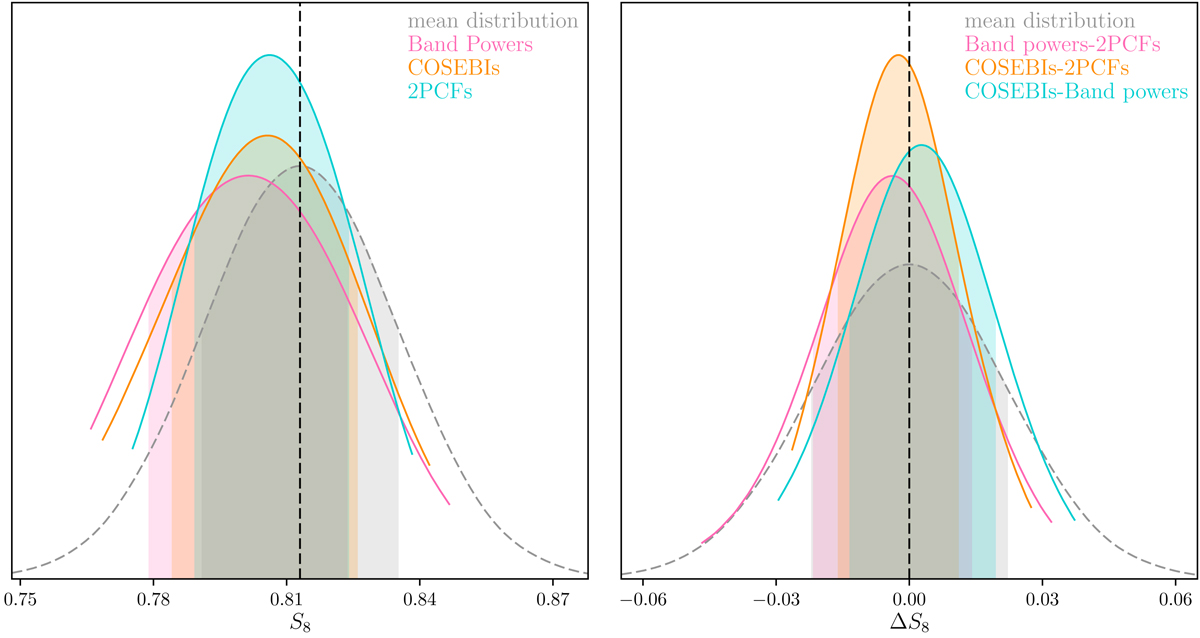
Distribution of inferred S8 values from 100 realisations of the data vector sampled from the covariance matrix. Left: the distribution of the maximum of the marginal distribution for S8. Results are shown for COSEBIs (orange), band powers (pink) and 2PCFs (cyan). For comparison we show a Gaussian distribution centred at the input value of S8 and a standard deviation equal to the mean of the individual standard deviations for each realisation and set of two-point statistics (grey dashed curve). Right: the difference between the S8 posterior modes of pairs of two-point statistics (as indicated in the legend) given the same noise realisation. The same reference Gaussian distribution is shown in grey (dashed curve) but centred on zero.
Current usage metrics show cumulative count of Article Views (full-text article views including HTML views, PDF and ePub downloads, according to the available data) and Abstracts Views on Vision4Press platform.
Data correspond to usage on the plateform after 2015. The current usage metrics is available 48-96 hours after online publication and is updated daily on week days.
Initial download of the metrics may take a while.