Fig. A.5.
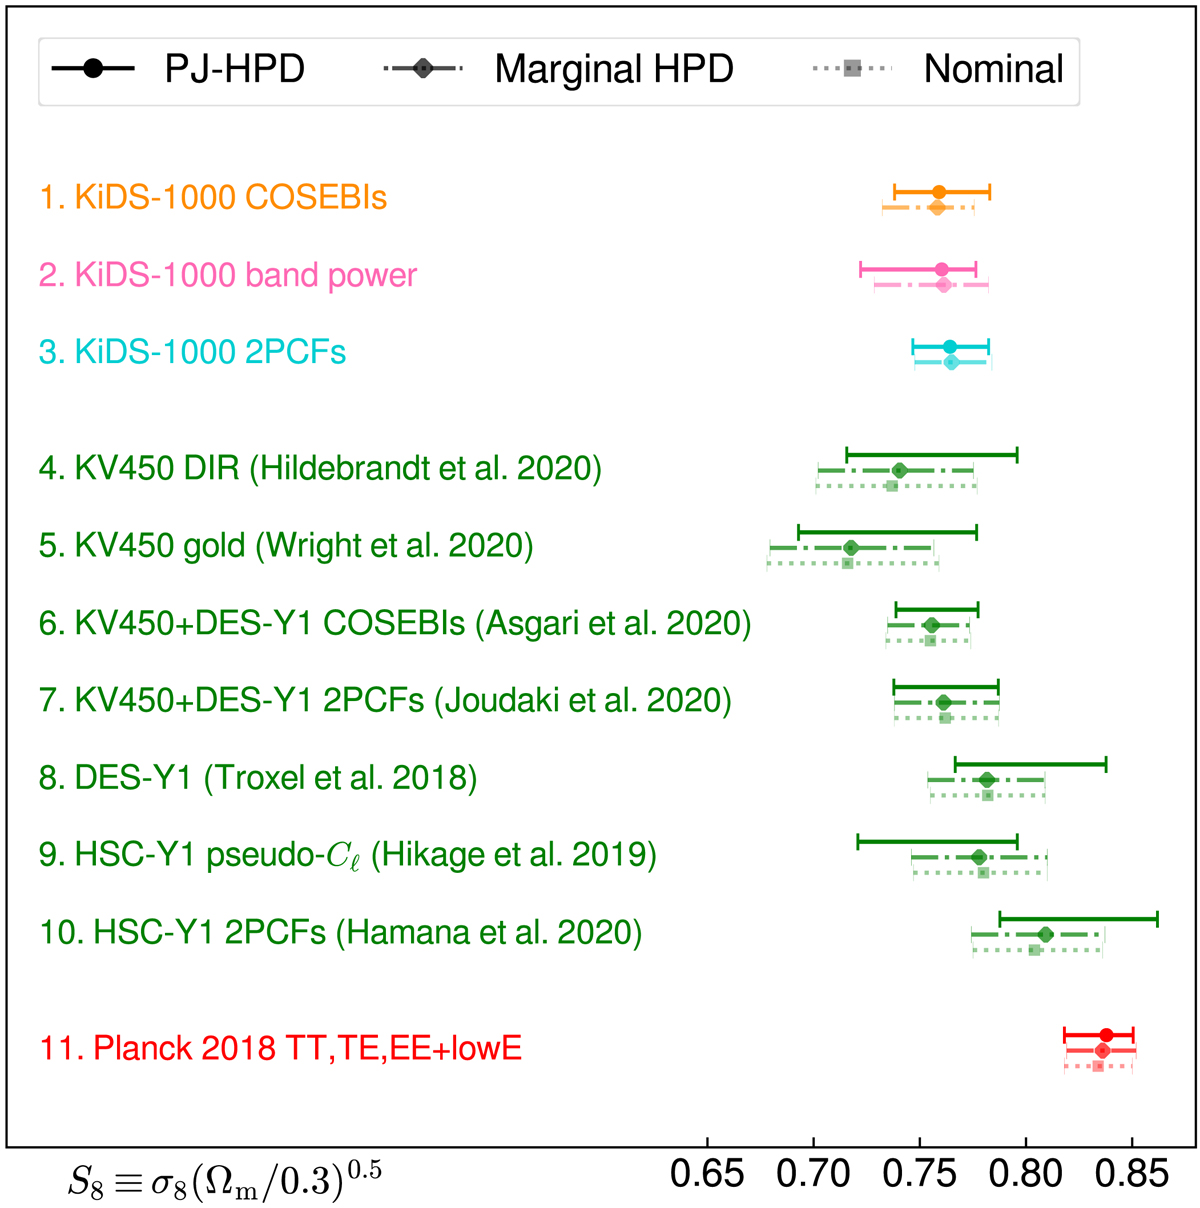
Comparison between S8 constraints of different surveys (extended version of Fig. 9). The top three group of bars show our KiDS-1000 results, for COSEBIs, band powers and 2PCFs. The green bars show the constraints from other cosmic shear surveys and the red ones refer to Planck 2018 results. The solid bar in each set shows the projected joint highest posterior density (PJ-HPD) credible region encompassing 68.3% of all sampled points (with the multivariate maximum posterior where determined). The dot-dashed bar displays the 1σ credible region around the maximum of the marginal distribution of S8 (Marginal HPD). For the external results we plot a third bar (dotted) showing their nominal reported values.
Current usage metrics show cumulative count of Article Views (full-text article views including HTML views, PDF and ePub downloads, according to the available data) and Abstracts Views on Vision4Press platform.
Data correspond to usage on the plateform after 2015. The current usage metrics is available 48-96 hours after online publication and is updated daily on week days.
Initial download of the metrics may take a while.