Fig. B.1
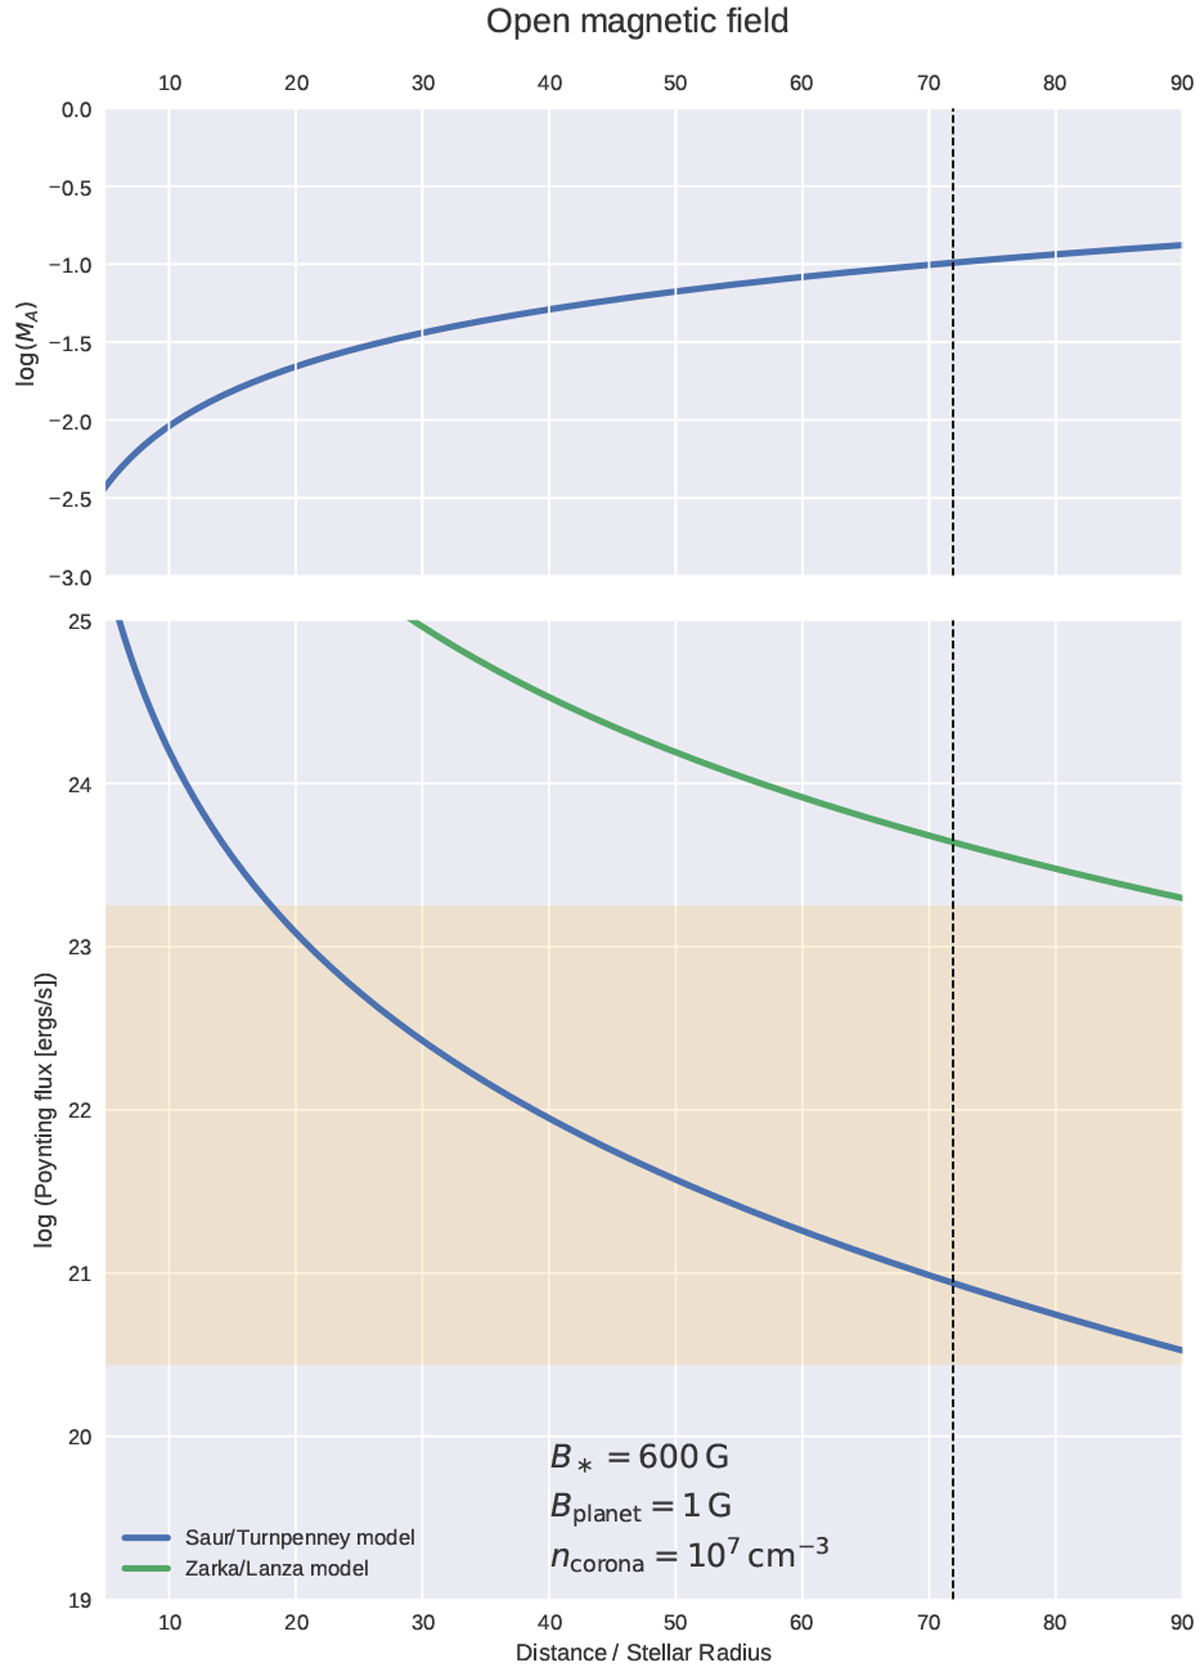
Comparison of theoretical expectations and observationally inferred values of the Poynting flux from sub-Alfvénic interaction in Proxima, for an open Parker spiral magnetic field geometry, as a function of the radial distance to the Proxima Cen star. Upper panel: Alfvén number, MA. The curves in the lower panel correspond to the theoretical Poynting flux, ![]() , for two different models of the interaction: the Saur/Turnpenney model (Saur et al. 2013; Turnpenney et al. 2018; solid blue line) and the Zarka-Lanza model (Zarka 2007; Lanza 2009; solid green line). The orange shaded region corresponds to the range of observationally inferred Poynting fluxes,
, for two different models of the interaction: the Saur/Turnpenney model (Saur et al. 2013; Turnpenney et al. 2018; solid blue line) and the Zarka-Lanza model (Zarka 2007; Lanza 2009; solid green line). The orange shaded region corresponds to the range of observationally inferred Poynting fluxes, ![]() , allowed by our observed radio flux densities, and the dashed line is drawn at the orbital distance of Proxima b.
, allowed by our observed radio flux densities, and the dashed line is drawn at the orbital distance of Proxima b.
Current usage metrics show cumulative count of Article Views (full-text article views including HTML views, PDF and ePub downloads, according to the available data) and Abstracts Views on Vision4Press platform.
Data correspond to usage on the plateform after 2015. The current usage metrics is available 48-96 hours after online publication and is updated daily on week days.
Initial download of the metrics may take a while.