Fig. 6

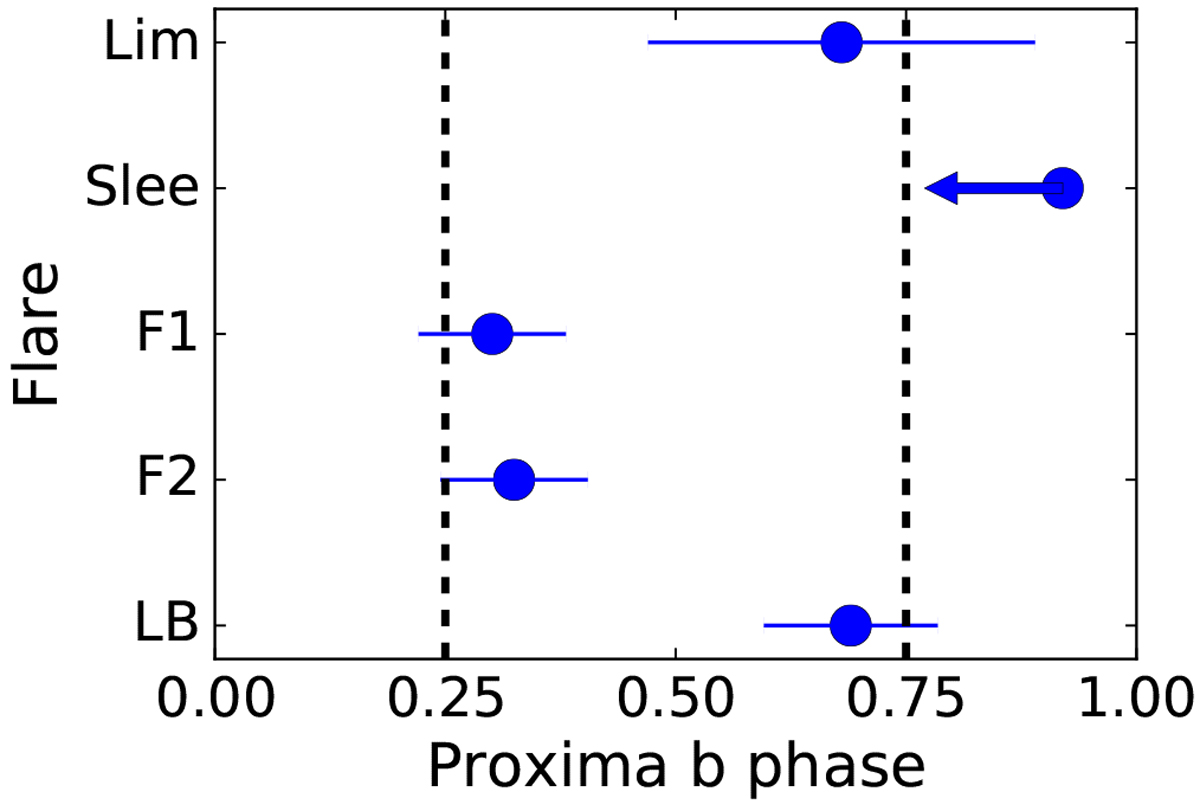
Identified radio flares at centimeter wavelengths (data points) from the Proxima Centauri system against orbital phase of their emission peaks. The dashed vertical lines correspond to the quadrature positions. During our ATCA observationstwo short flares, F1 and F2 (Fig. 2 and Sect. 3.2), and a long-lasting burst, LB (Fig. 2), were observed. The flares labeled “Lim” and “Slee” correspond to the centimeter wavelength flares observed in 1991 and 2000 by Lim et al. (1996) and Slee et al. (2003) (see Sect. 4.3). The error bars indicate the total uncertainties on the phases of the flares, including the contributions due to the uncertainty on the time of the flare peak, on the orbital period, and on the absolute phase reference. The Slee flare peaked before the start of those observations, and only an upper limit to its phase is known. This is indicated by the blue arrow.
Current usage metrics show cumulative count of Article Views (full-text article views including HTML views, PDF and ePub downloads, according to the available data) and Abstracts Views on Vision4Press platform.
Data correspond to usage on the plateform after 2015. The current usage metrics is available 48-96 hours after online publication and is updated daily on week days.
Initial download of the metrics may take a while.


