Fig. 5
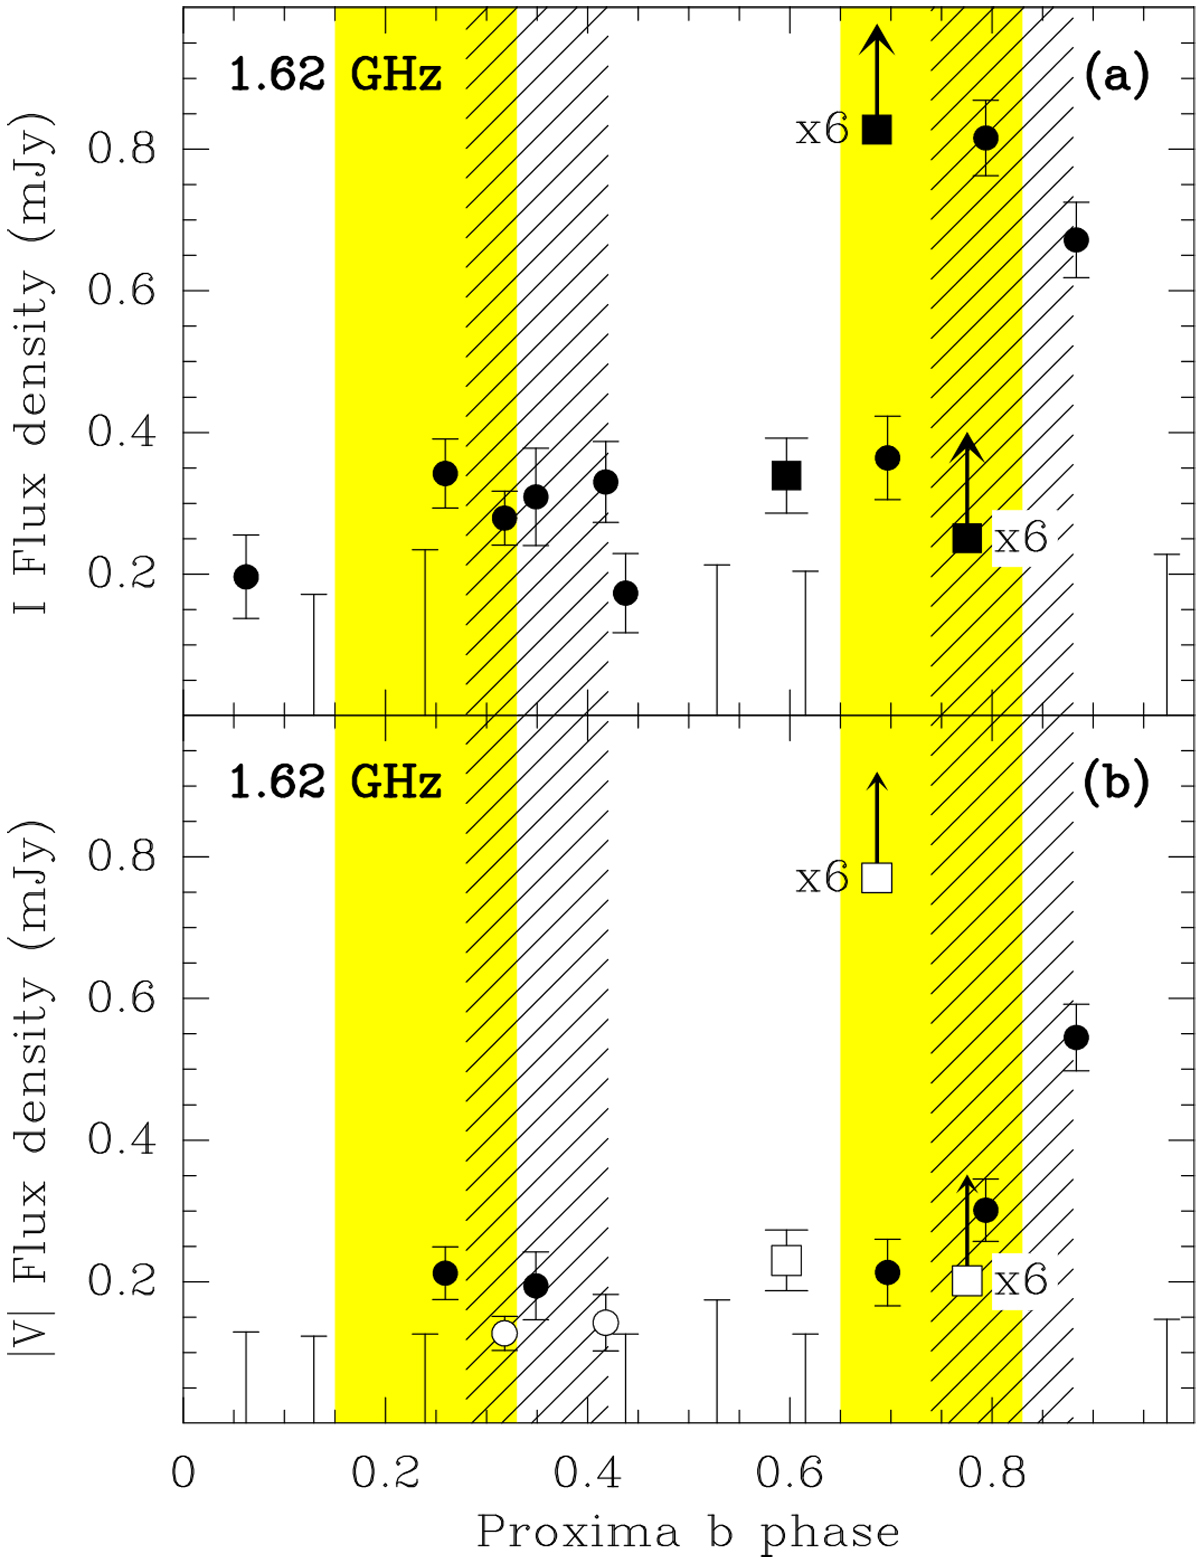
Flux density light curve of Proxima (1.62 GHz) folded to the orbital period of the planet Proxima b, covering ~1.6 orbital periods. Variation of the total flux density (Stokes I) as a function of the orbital phase of Proxima b (Porb =11.186 days; Anglada-Escudé et al. 2016). The conjunction time, corresponding to the value 0.0 of the orbital phase, is determined to be April 20, 22:57 UTC, with a 90% confidence interval of [+21.7, −26.1] h. The last three days of observations (April 27, 28, and 29; square symbols) correspond to a significantly brighter emission burst, and have been analyzed separately. The 1.62 GHz flux density values are higher in two well-defined regions of the orbital cycle of Proxima b. The centroids of these regions correspond to orbital phases of 0.36 and 0.81 (excluding the data from the brighter burst), and the hatched regions represent the rms width of the maxima of emission. The yellow shaded areas correspond to the 90% confidence interval around the first and second quadratures. The filled and open symbols in panel b correspond to positive and negative values of Stokes V, respectively. The error bars correspond to 1σ uncertainties.
Current usage metrics show cumulative count of Article Views (full-text article views including HTML views, PDF and ePub downloads, according to the available data) and Abstracts Views on Vision4Press platform.
Data correspond to usage on the plateform after 2015. The current usage metrics is available 48-96 hours after online publication and is updated daily on week days.
Initial download of the metrics may take a while.