Fig. 4
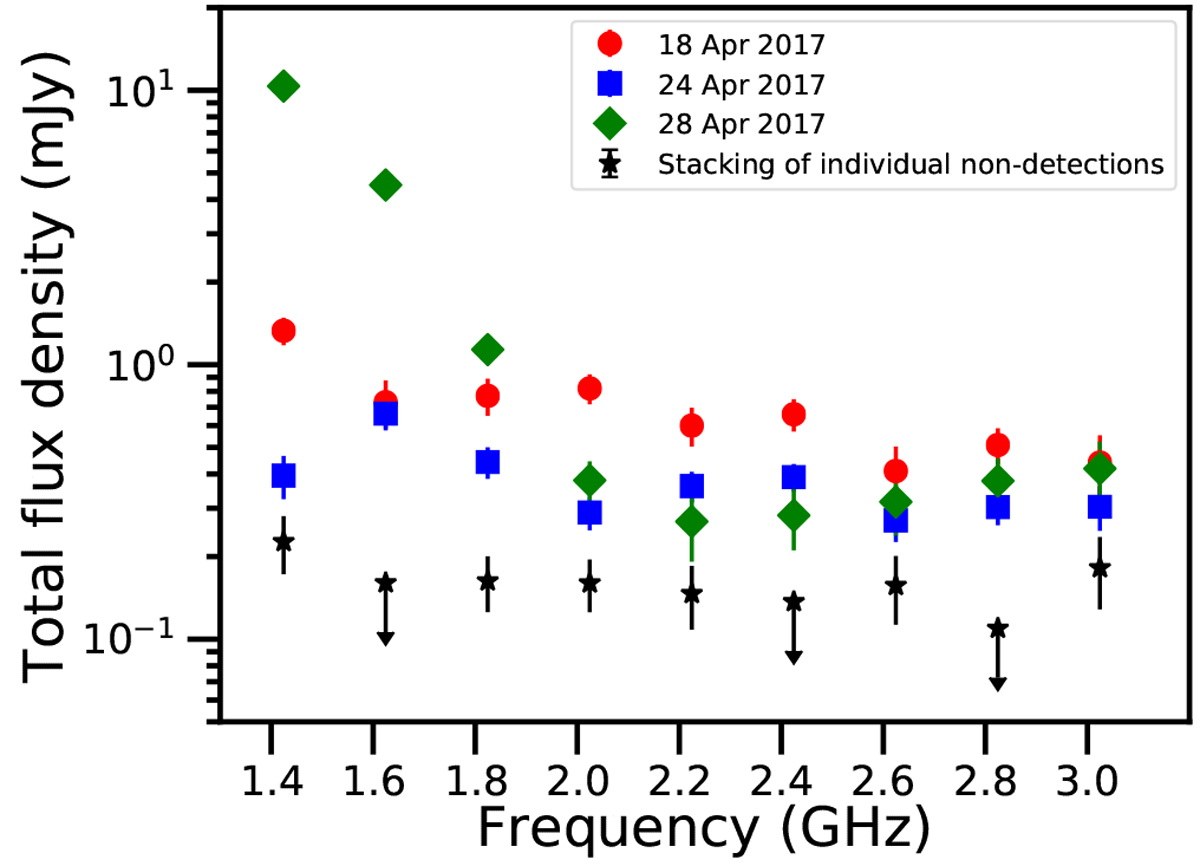
Illustration of the day-to-day radio spectral evolution of Proxima. Data correspond to the total flux density (Stokes I) on April 18 (circles), April 24 (squares), and April 28 (diamonds) over the whole observing bandwidth, averaged every 200 MHz. For comparison, we also show the result of stacking the data corresponding to the five individual observing epochs where there was no detection (data of April 16, 20, 22, 23, and 26), drawn as stars. Arrows indicate 3σ upper limits.
Current usage metrics show cumulative count of Article Views (full-text article views including HTML views, PDF and ePub downloads, according to the available data) and Abstracts Views on Vision4Press platform.
Data correspond to usage on the plateform after 2015. The current usage metrics is available 48-96 hours after online publication and is updated daily on week days.
Initial download of the metrics may take a while.