Fig. 3
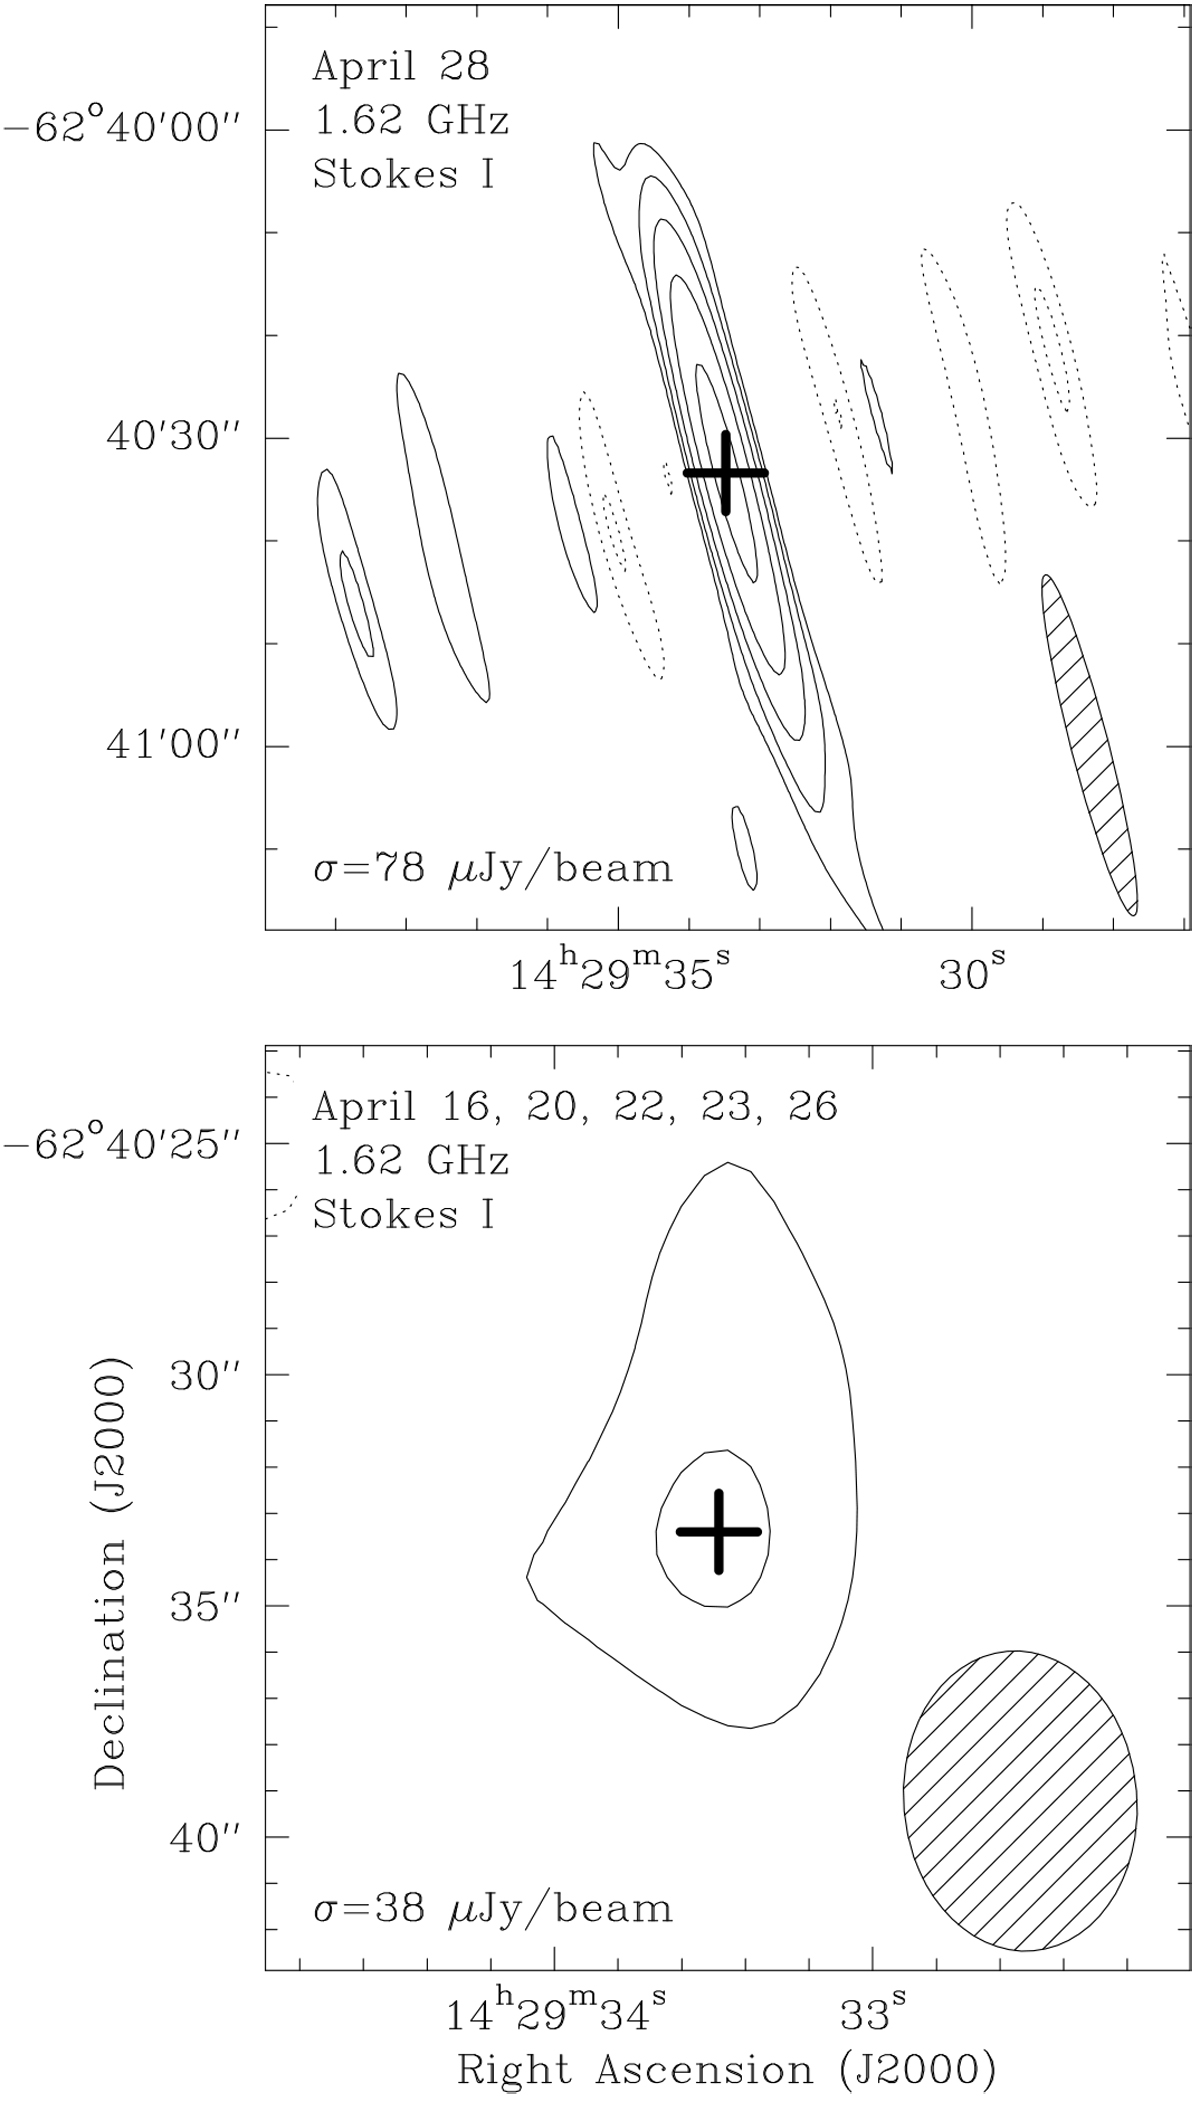
Contour maps of Proxima at 1.62 GHz during maximum and minimum emission. Top panel: emission on April 28, 2017, when the flux density was at its maximum. Contour levels are drawn at −6, −3, 3, 6, 12, 24, and 48 × 78 μJy beam−1, the rms of the map. Bottom panel: map obtained by combining the uv data for the observing epochs when the emission was not detected in each of the individual images (April 16, 20, 22, 23, and 26, 2017). Contour levels are drawn at −2, 2, and 4 × 38 μJy beam−1, the rms of the map. In both maps the solid and dotted contours represent positive and negative levels, respectively.
Current usage metrics show cumulative count of Article Views (full-text article views including HTML views, PDF and ePub downloads, according to the available data) and Abstracts Views on Vision4Press platform.
Data correspond to usage on the plateform after 2015. The current usage metrics is available 48-96 hours after online publication and is updated daily on week days.
Initial download of the metrics may take a while.