Fig. 2
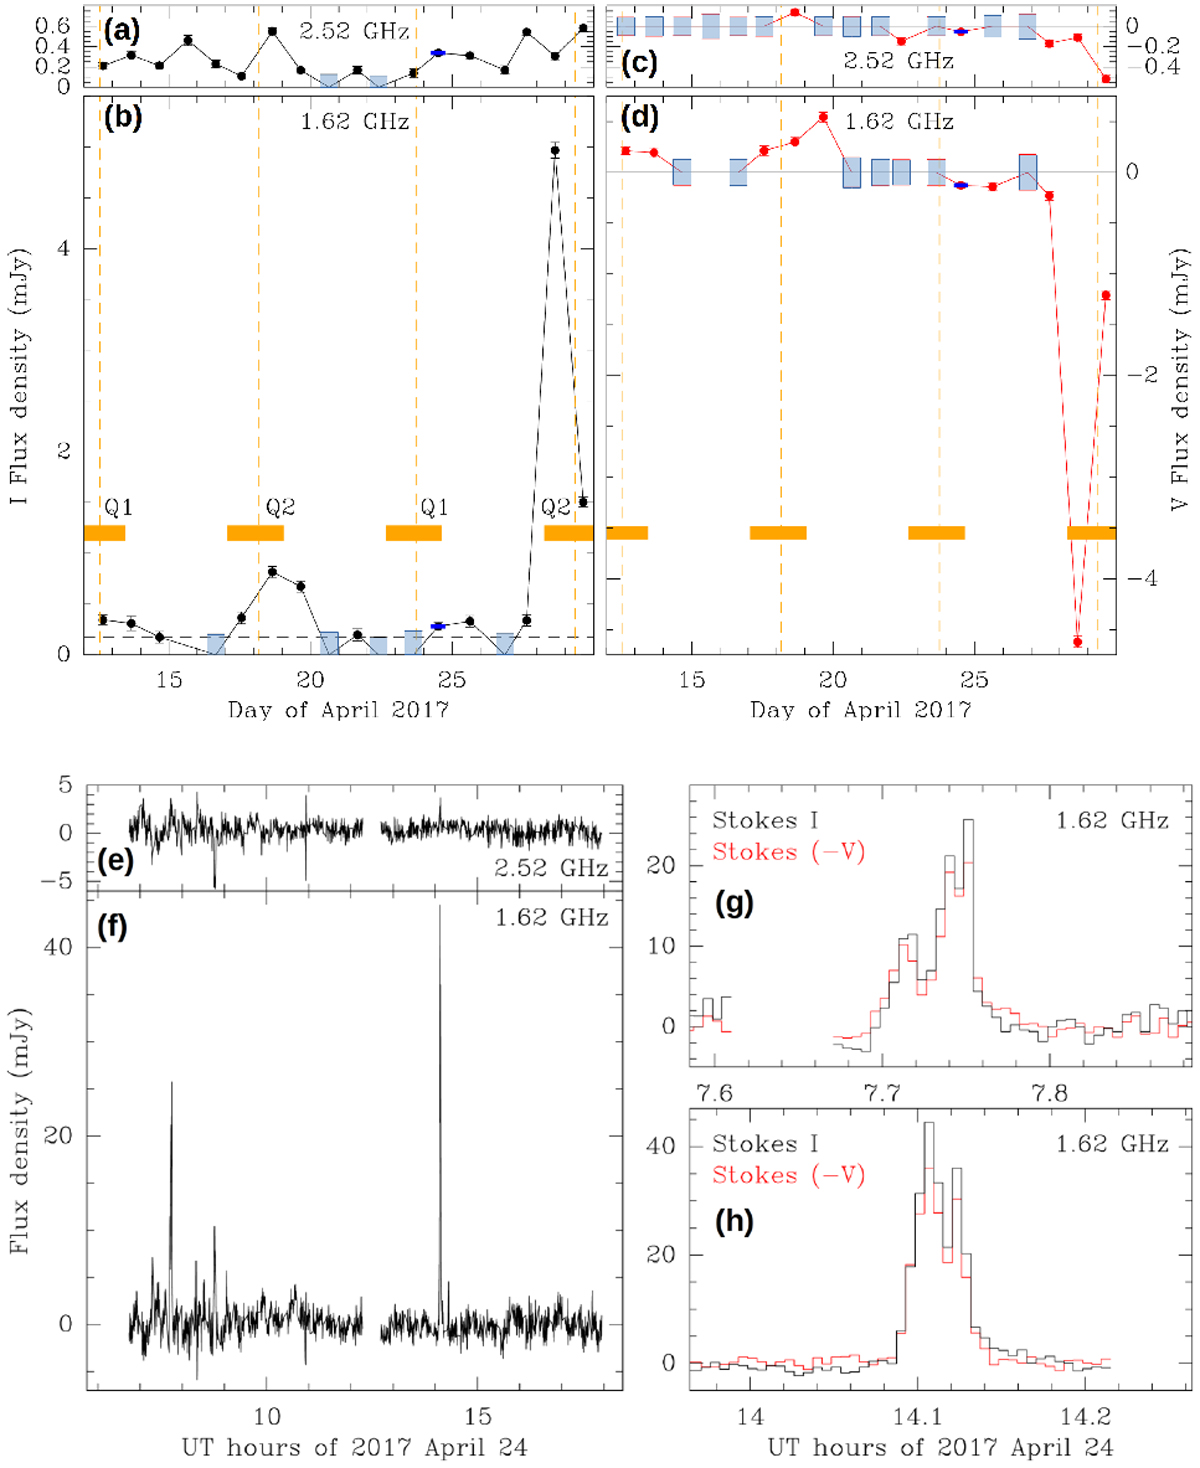
Time evolution of flux density in Proxima. Variation of total (Stokes I; panels a and b) and circularly polarized (Stokes V; panels c and d) flux density as a function of time during our ATCA observing campaign. For each observing session the data is averaged over a bandwidth of 400 MHz and 1 GHz centered at 1.62 GHz [wavelength ≃ 18.5 cm; (b,d)] and 2.52 GHz [≃ 11.9 cm; (a,c)], respectively. Vertical lines indicate 1σ uncertainties for each data point, and blue shaded rectangles are 3σ upper limits for non-detections (in the case of Stokes V, they correspond to upper limits to the absolute value of the flux density). The duration of the observation on April 24, 2017 (12 h), is represented with a horizonal blue bar, while the observing time of the other days (~2 h) is smaller than the symbol size of data points. Dashed orange lines show the quadratures, Q1 and Q2, of Proxima b, with the horizontal orange bars indicating the statistical uncertainty on the determination of the epoch of the quadratures (see text fordetails). The horizontal dashed line in the plot of Stokes I at 1.62 GHz (b) corresponds to a flux density of 0.174 ± 0.038 mJy, obtained by averaging together the data over the five observing sessions where the source was not detected individuallyat that frequency. No map could be obtained at low frequency on April 15, 2017, due to an insufficient number of unflagged visibilities. Panels e and f: variation of Stokes I during April 24, 2017, for data averaged over 20 s intervals. Two short-duration flares are evident at 1.62 GHz (f). Panels g and h: temporal close-up of the two flares. The black and red lines correspond to Stokes I and V, respectively. The sign of Stokes V has been reversed for better visualization.
Current usage metrics show cumulative count of Article Views (full-text article views including HTML views, PDF and ePub downloads, according to the available data) and Abstracts Views on Vision4Press platform.
Data correspond to usage on the plateform after 2015. The current usage metrics is available 48-96 hours after online publication and is updated daily on week days.
Initial download of the metrics may take a while.