Fig. 1
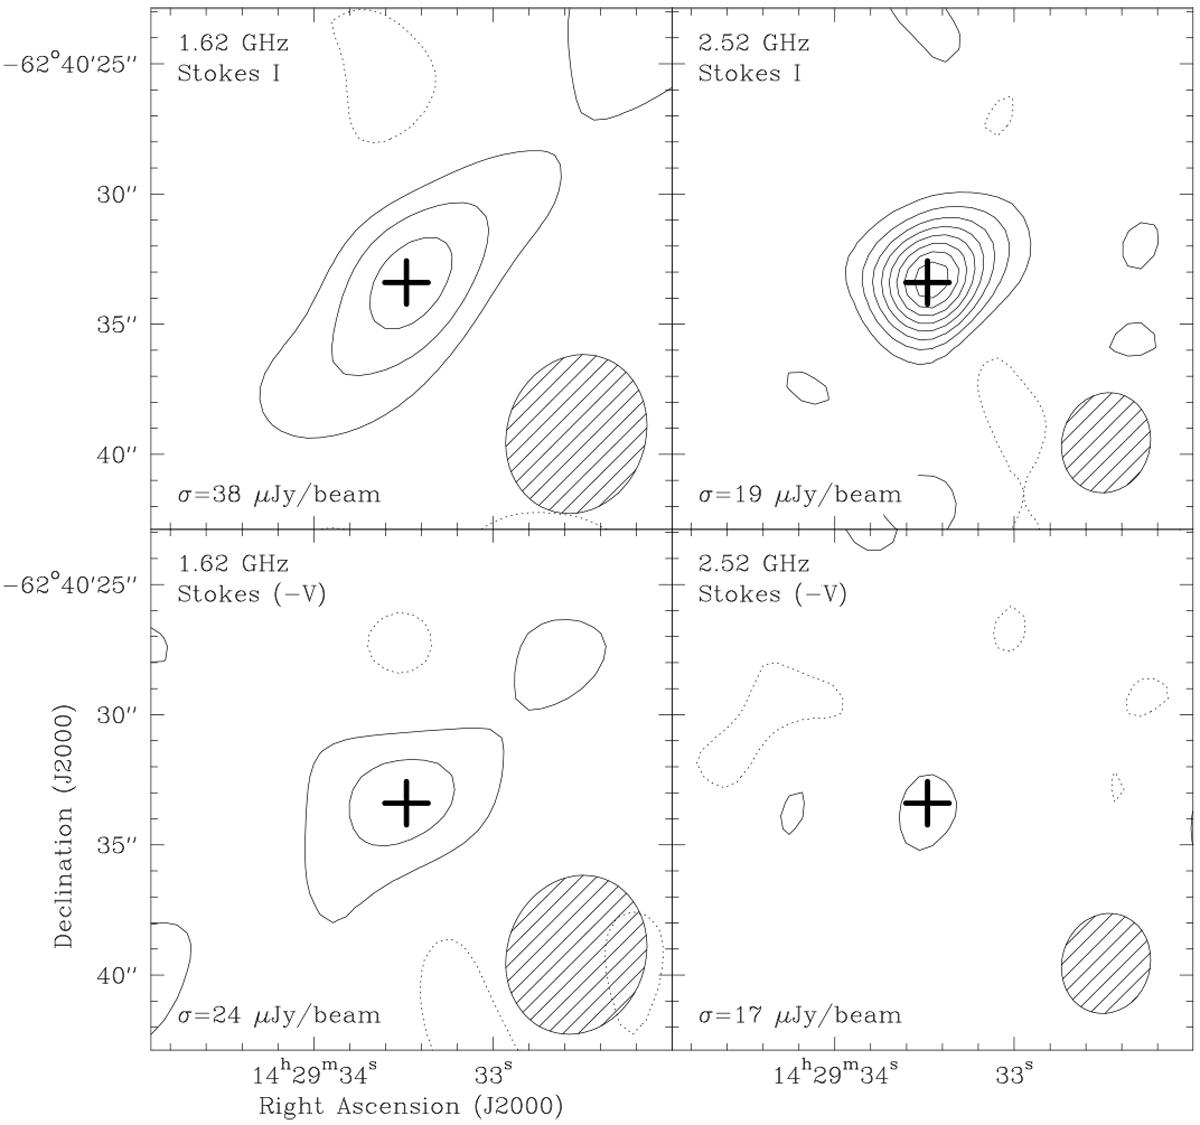
Contour maps of radio continuum emission from the Proxima Centauri system on April 24, 2017. The maps correspond to total (Stokes I) and circularly polarized (Stokes V) flux density, for two bands: 400 MHz centered at 1.62 GHz, and 1 GHz centered at 2.52 GHz. Contour levels are drawn at −2, 2, 4, 6, 8, 10, 12, 14, and 16 times the rms of each map (denoted by σ in each panel). The sign of the Stokes V maps was inverted for better visualization, so solid contours in the two bottom panels actually represent negative values of the circularly polarized flux density. The hatched ellipse in the bottom right corner of each panel represents the half-power contour of the synthesized beams. The cross corresponds to the position of the star Proxima for the observing epoch, obtained from the 1.3 mm ALMA data reported in Anglada et al. (2017), taking into account the proper motion and parallax of the star.
Current usage metrics show cumulative count of Article Views (full-text article views including HTML views, PDF and ePub downloads, according to the available data) and Abstracts Views on Vision4Press platform.
Data correspond to usage on the plateform after 2015. The current usage metrics is available 48-96 hours after online publication and is updated daily on week days.
Initial download of the metrics may take a while.