Fig. 15
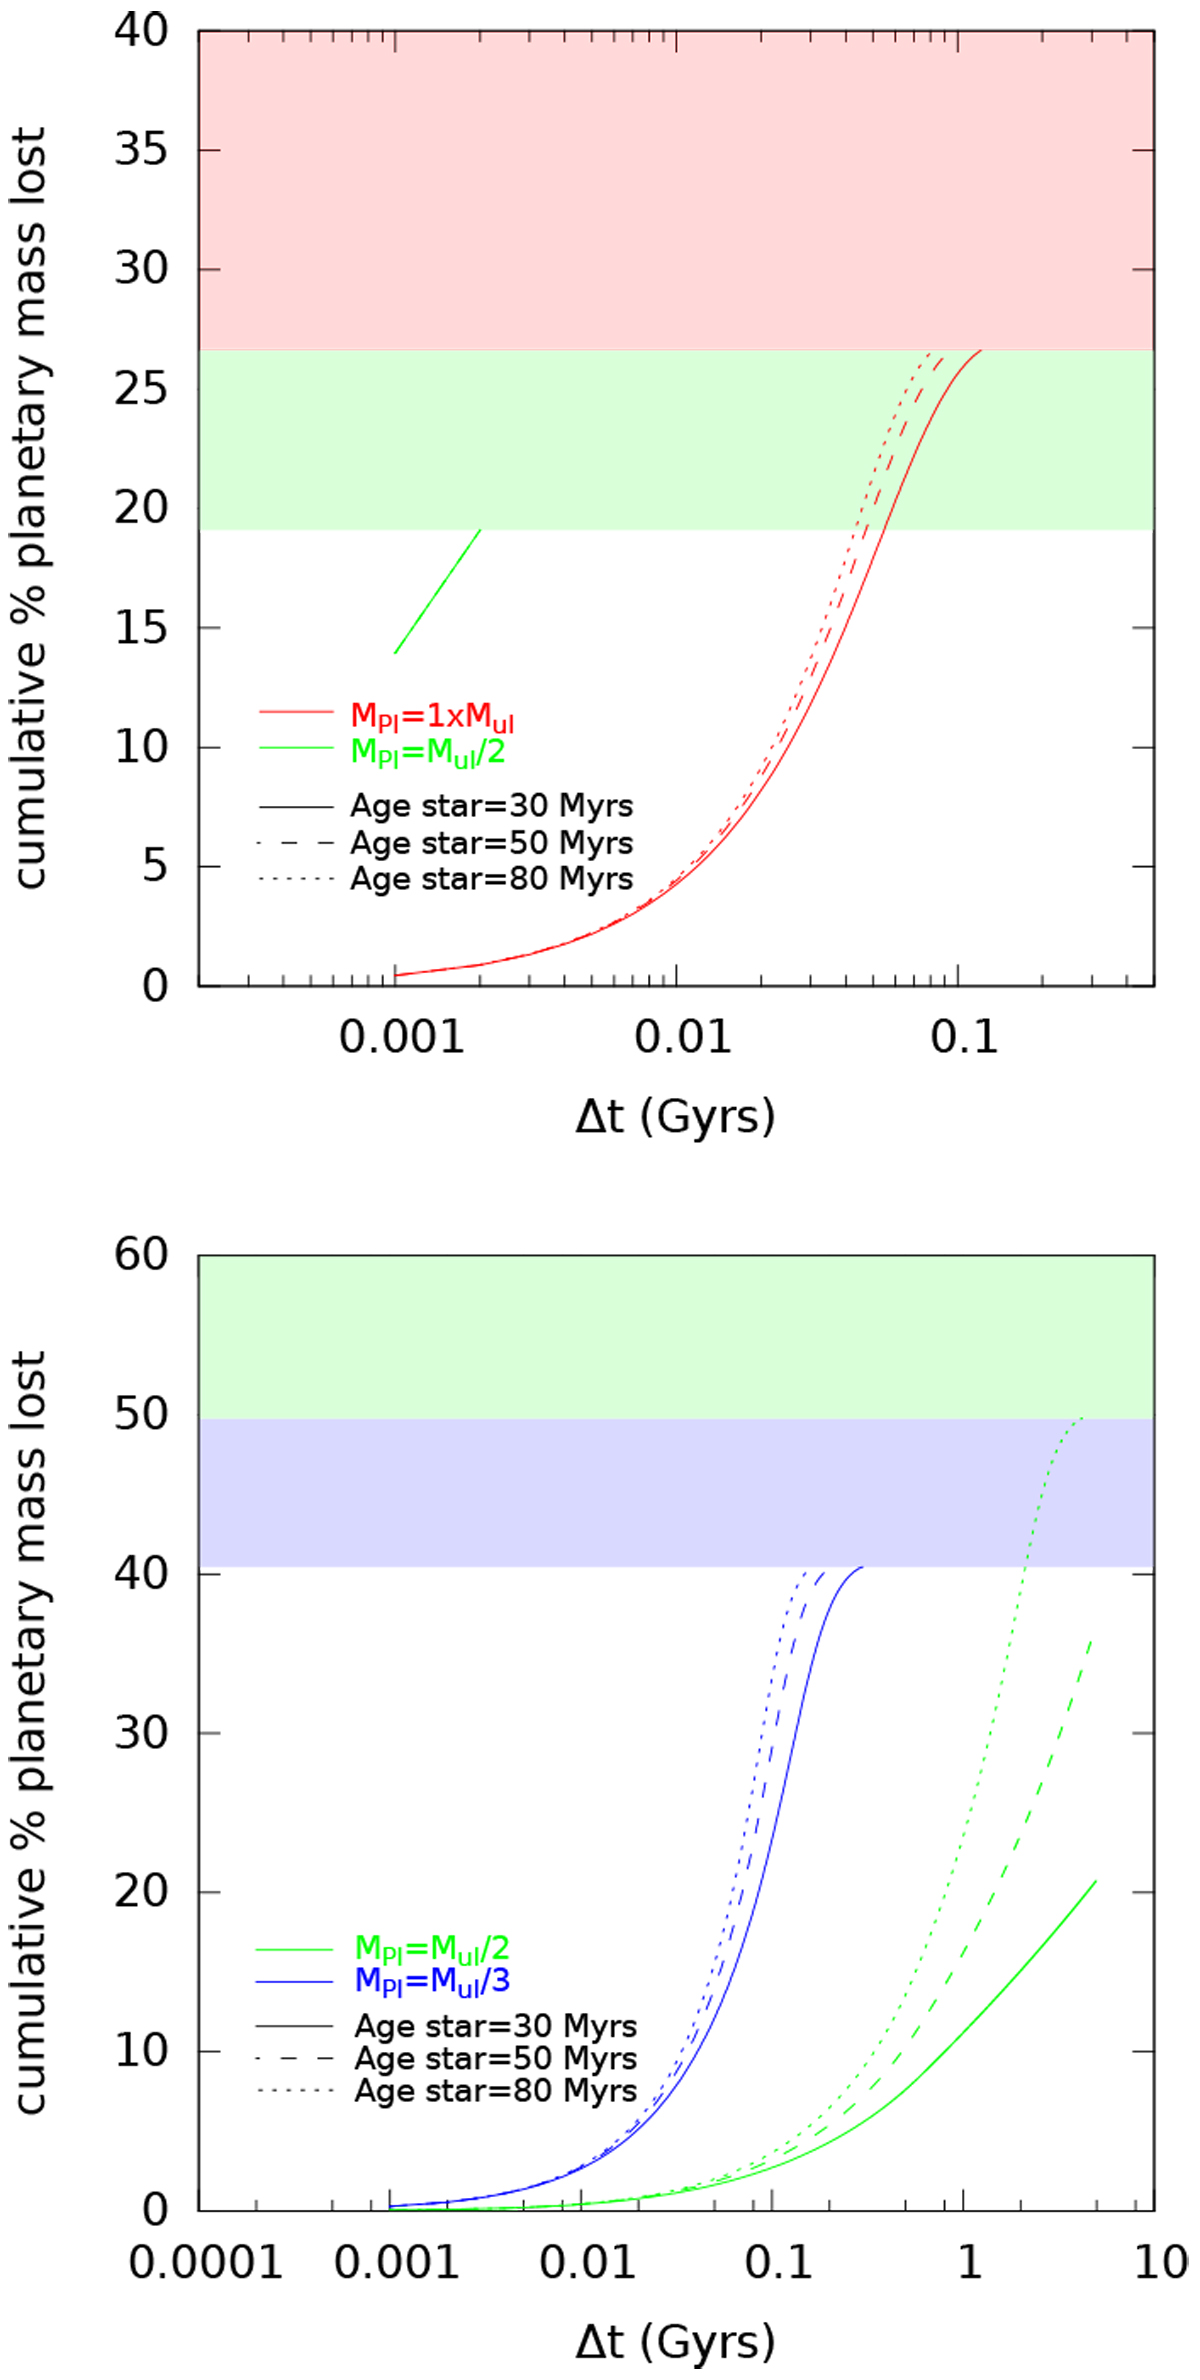
Cumulative percentage of mass loss as a function of Δt = t − Tage. Red, green, and blue lines refer to planetary masses of 1 × Mul, ![]() , and
, and ![]() , respectively. Stellar ages of 30, 50, and 80 Myr are shown in solid, dashed, and dotted lines, respectively. The shaded areas represent the threshold of mass loss: above this limit the planet cannot lose any further mass. Upper panel: TOI-942 b. Bottom panel: TOI-942 c.
, respectively. Stellar ages of 30, 50, and 80 Myr are shown in solid, dashed, and dotted lines, respectively. The shaded areas represent the threshold of mass loss: above this limit the planet cannot lose any further mass. Upper panel: TOI-942 b. Bottom panel: TOI-942 c.
Current usage metrics show cumulative count of Article Views (full-text article views including HTML views, PDF and ePub downloads, according to the available data) and Abstracts Views on Vision4Press platform.
Data correspond to usage on the plateform after 2015. The current usage metrics is available 48-96 hours after online publication and is updated daily on week days.
Initial download of the metrics may take a while.