Fig. 13
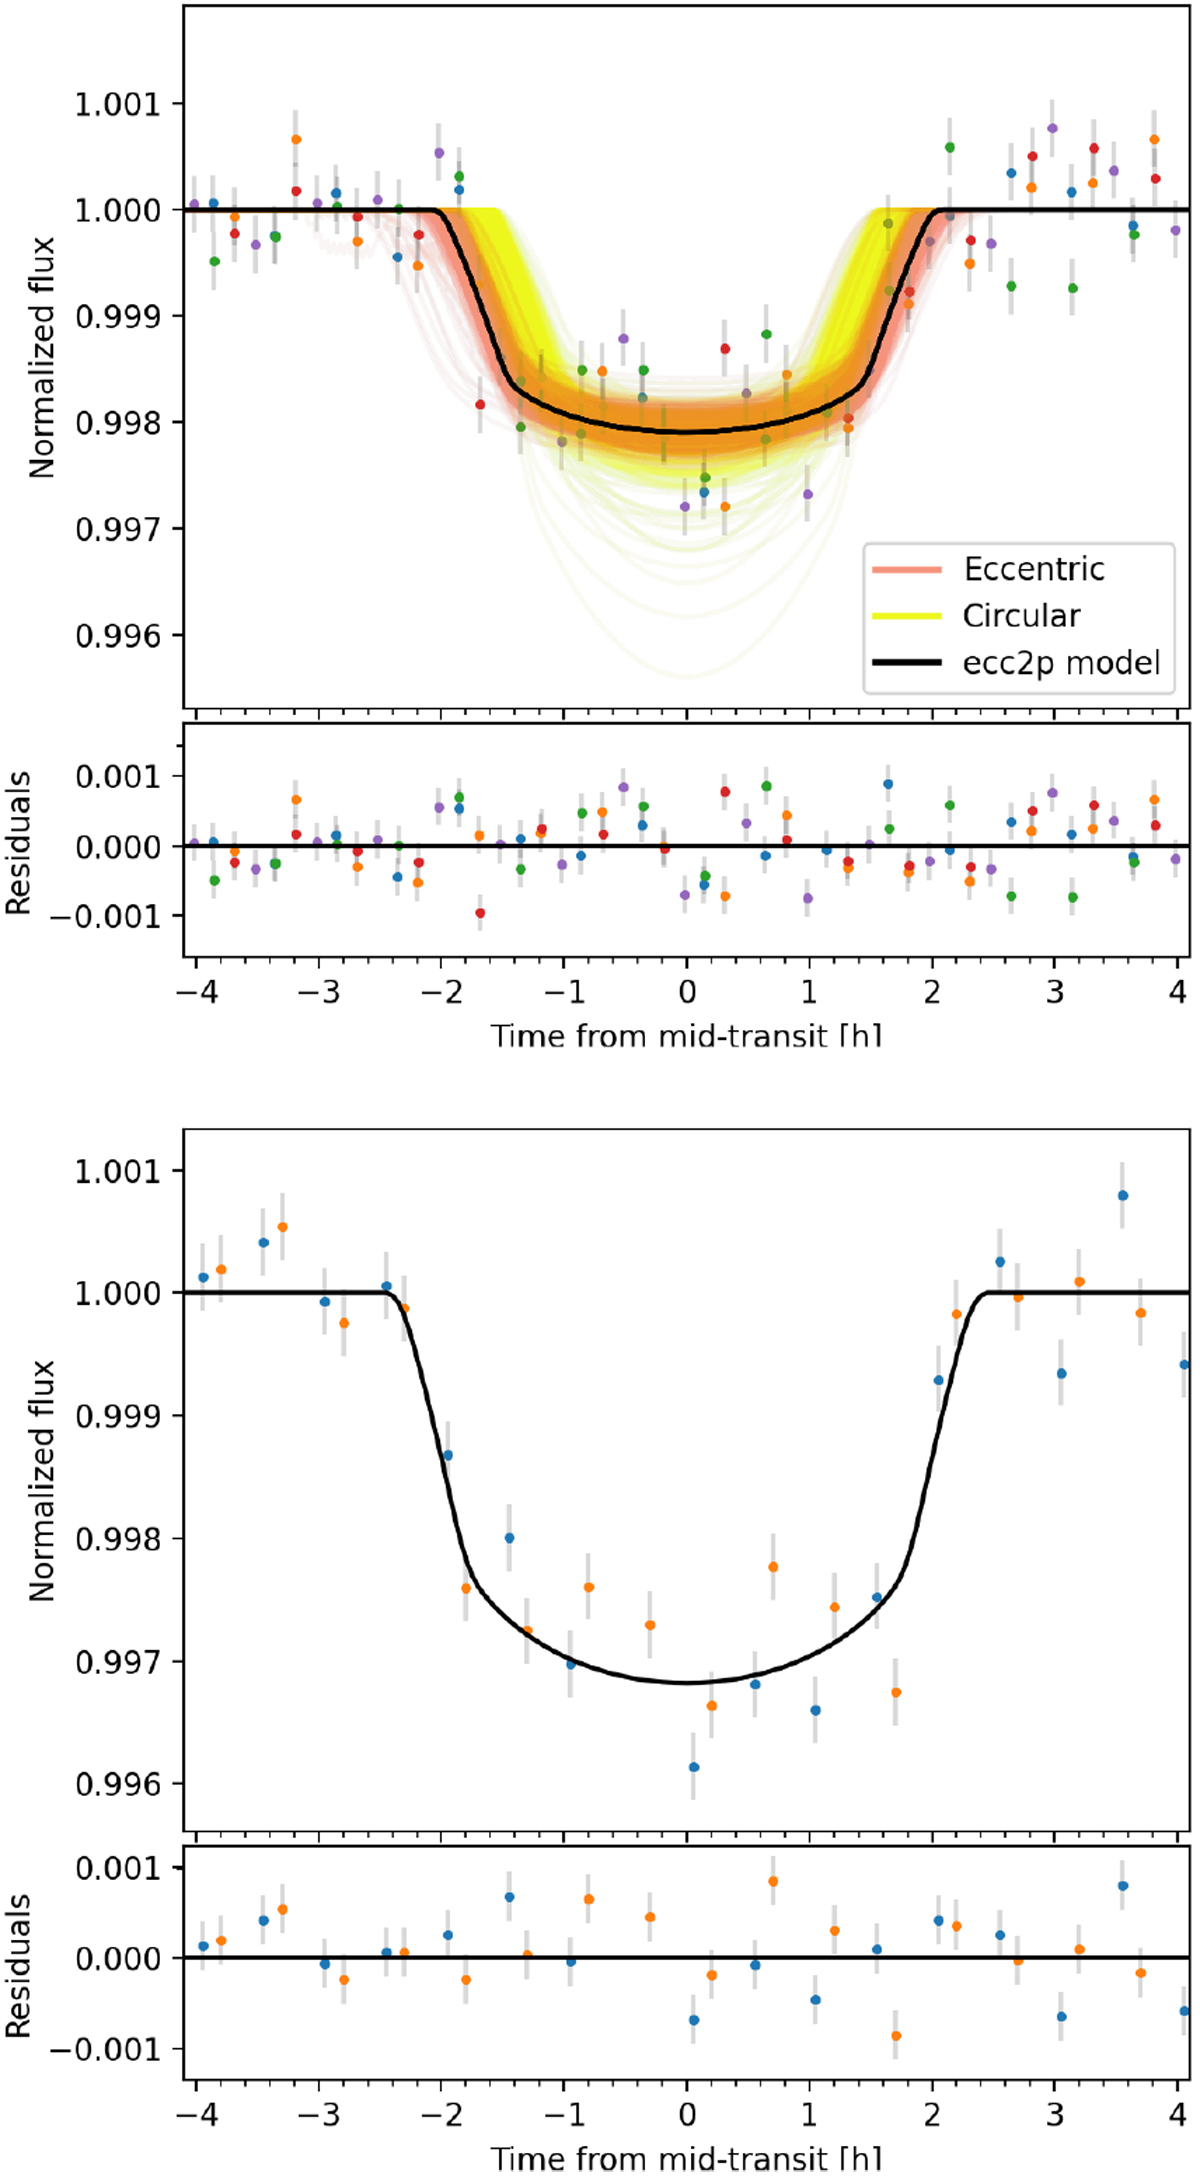
Upper panel: TESS light curve around the transit with residuals of TOI-942 b. The black fit is the inferred ecc2p transit model, while the orange and yellow fits are respectively the eccentric and circular models obtained by randomly varying all the orbital parameters. Different dot colors indicate the five different transits for TOI-942 b. Bottom panel: TESS light curve around the two transits of TOI-942 c, with the ecc2p model overplotted.
Current usage metrics show cumulative count of Article Views (full-text article views including HTML views, PDF and ePub downloads, according to the available data) and Abstracts Views on Vision4Press platform.
Data correspond to usage on the plateform after 2015. The current usage metrics is available 48-96 hours after online publication and is updated daily on week days.
Initial download of the metrics may take a while.