Fig. 12
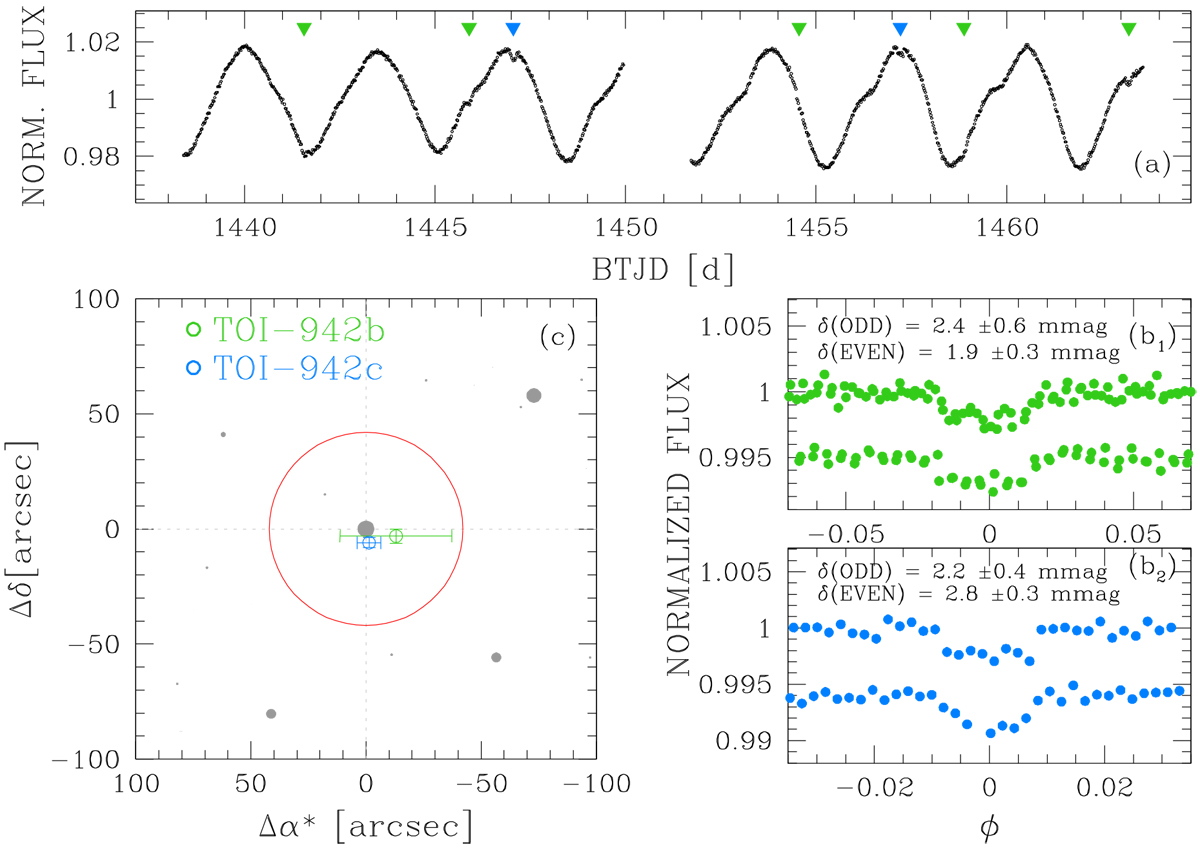
Vetting procedure for TOI-942 b (green) and TOI-942 c (blue). Panel a: normalized light curve of TOI-942: green and blue arrows mark the position of the single transits of TOI-942 b and TOI-942 c, respectively. Panels b: comparison between the depths δ of the odd and even transits for the two exoplanets. Panel c: finding chart, centered on TOI-942 and based on the Gaia DR2 catalog: green and blue points represent the centroids computed analyzing the image obtained from the difference between theout- and in-of-transit stacked images; the red circle is the photometric aperture adopted in this work (see text and Nardiello et al. 2020 for details).
Current usage metrics show cumulative count of Article Views (full-text article views including HTML views, PDF and ePub downloads, according to the available data) and Abstracts Views on Vision4Press platform.
Data correspond to usage on the plateform after 2015. The current usage metrics is available 48-96 hours after online publication and is updated daily on week days.
Initial download of the metrics may take a while.