Fig. 8.
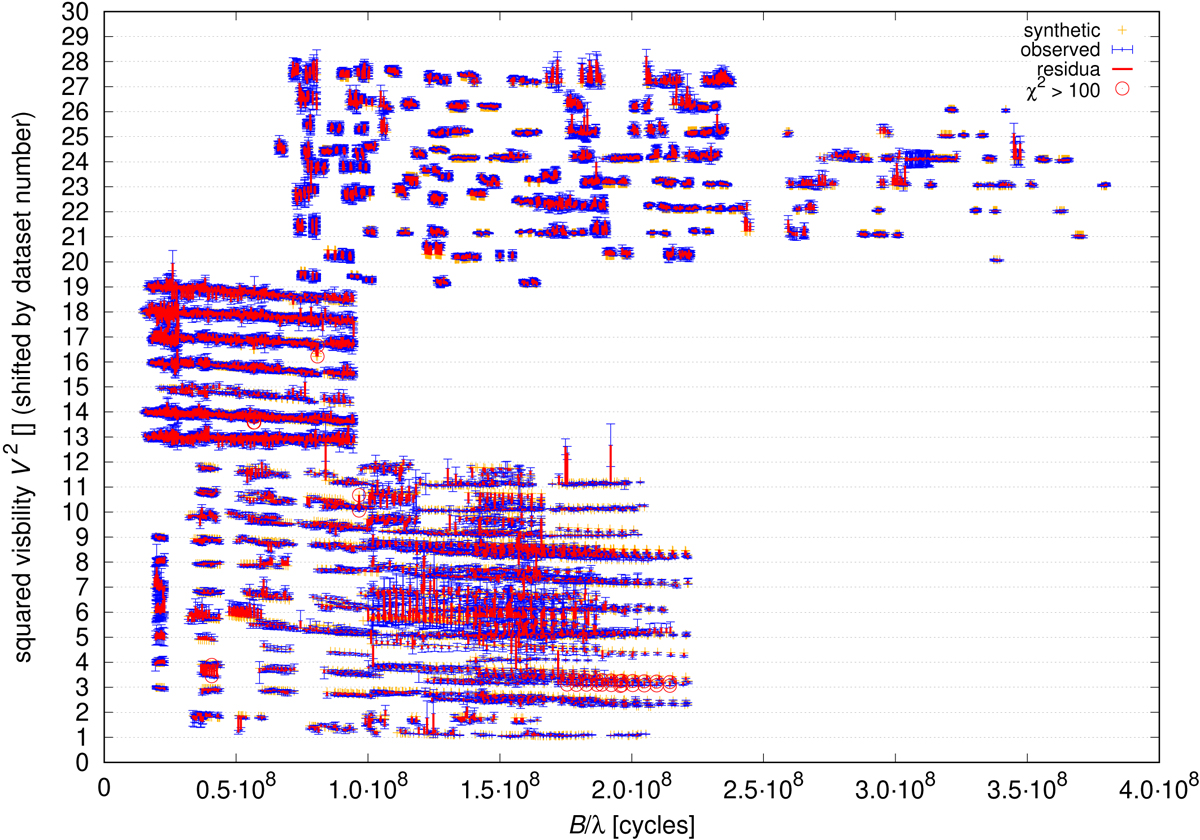
Squared visibility |V2| (shifted by dataset number) for different baselines B/λ (in cycles). The CHARA/MIRC observations are at the bottom, NPOI in the middle, and CHARA/VEGA at the top (blue); synthetic data for the joint model are plotted for comparison (yellow). Overall trends (|V2|(B/λ)) seem to be correctly described, although there are some systematics for small groups of data.
Current usage metrics show cumulative count of Article Views (full-text article views including HTML views, PDF and ePub downloads, according to the available data) and Abstracts Views on Vision4Press platform.
Data correspond to usage on the plateform after 2015. The current usage metrics is available 48-96 hours after online publication and is updated daily on week days.
Initial download of the metrics may take a while.