Fig. 6.
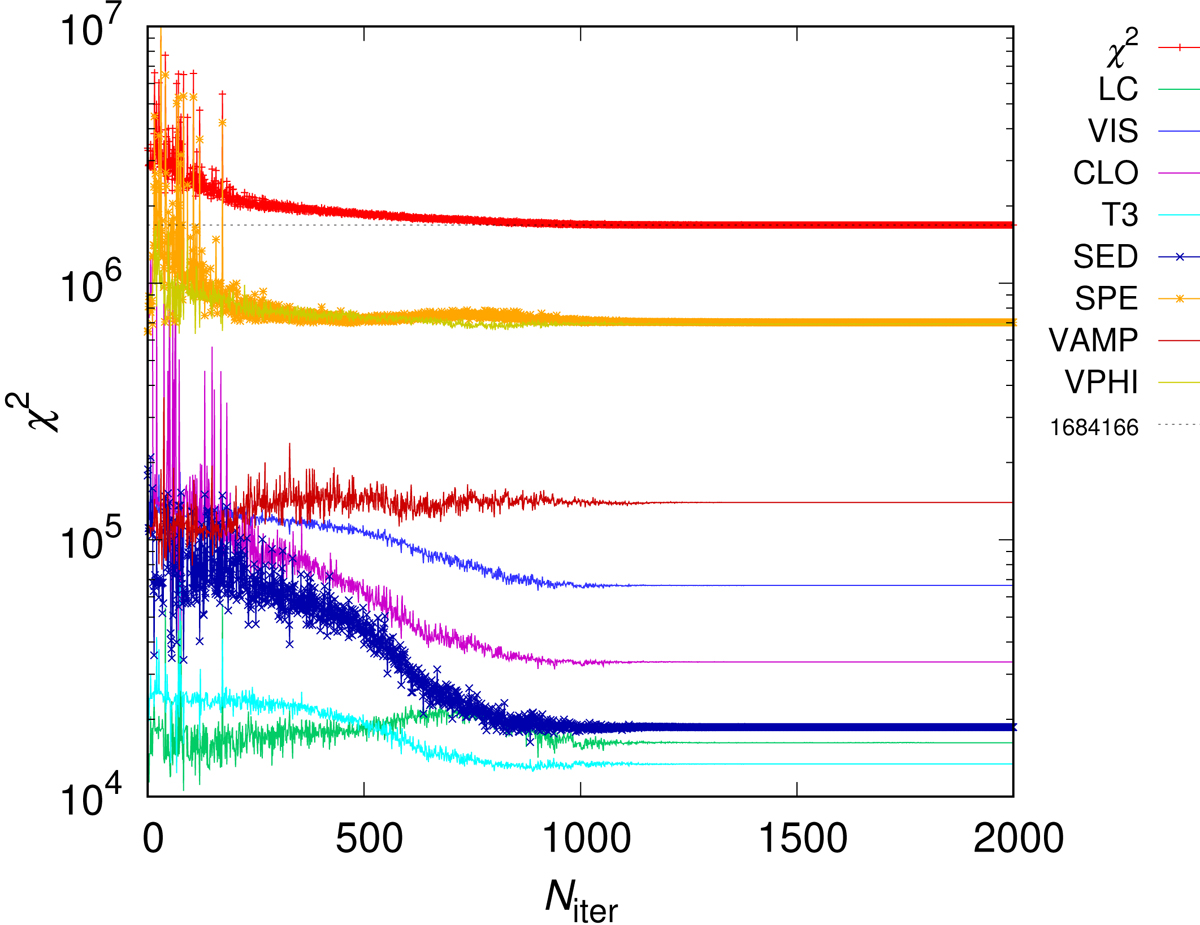
χ2 convergence (red) for joint model; individual contributions (LC, VIS, CLO, T3, SED, SPE, VAMP, VPHI) are also indicated. The model successfully converges to a local minimum. Some datasets have a substantially larger number of observations, (i.e. effectively a larger weight). The χ2 values are different from Table 1 because the model was re-converged several times, and uncertainties of some datasets were modified.
Current usage metrics show cumulative count of Article Views (full-text article views including HTML views, PDF and ePub downloads, according to the available data) and Abstracts Views on Vision4Press platform.
Data correspond to usage on the plateform after 2015. The current usage metrics is available 48-96 hours after online publication and is updated daily on week days.
Initial download of the metrics may take a while.