Fig. 5.
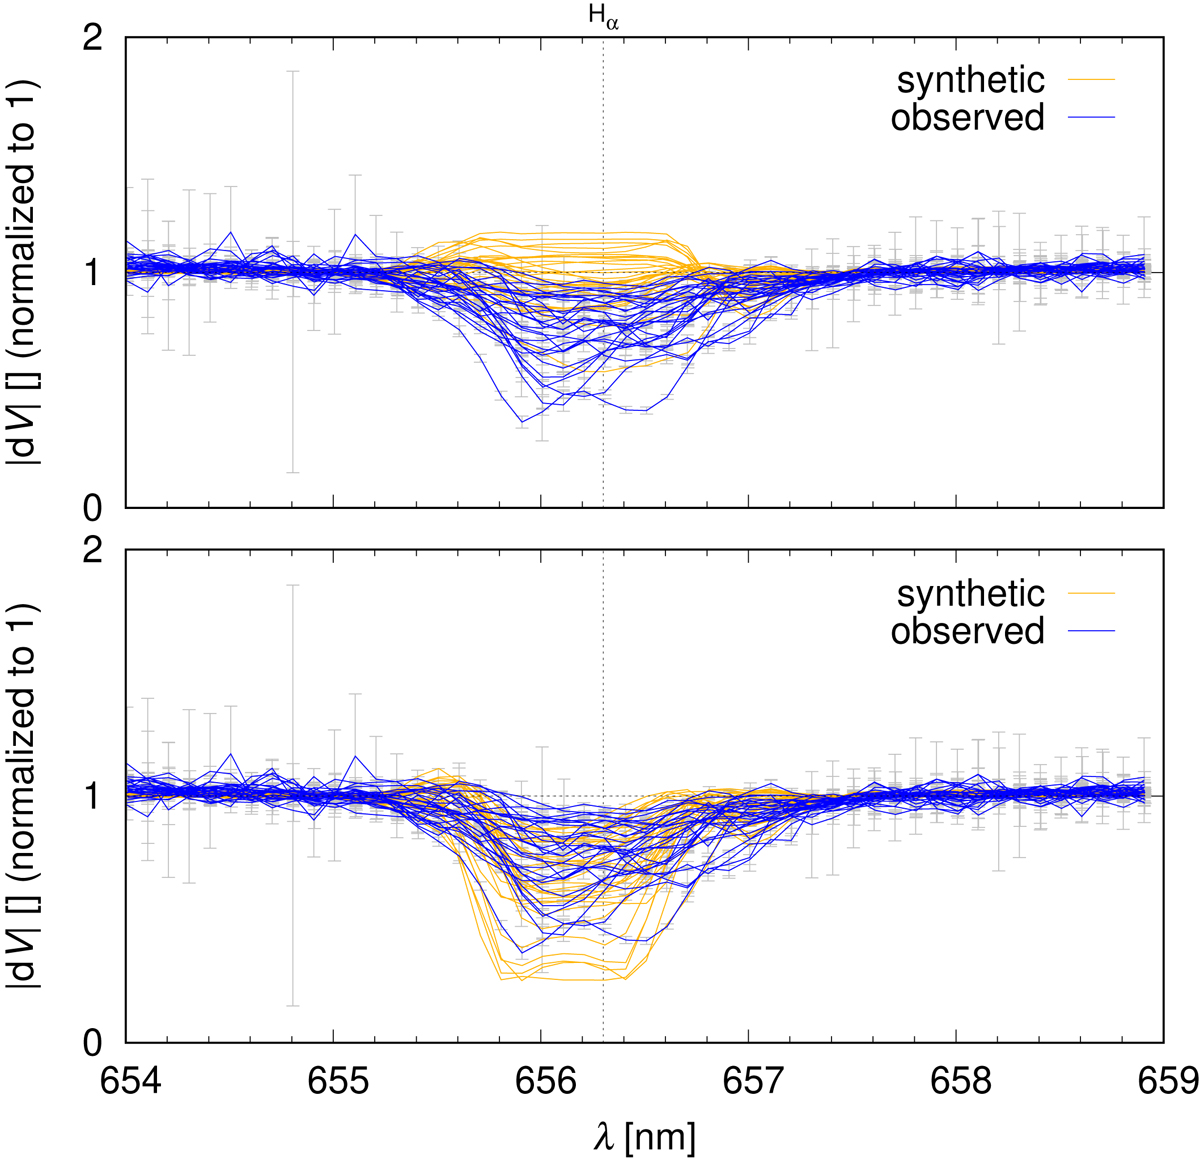
Observed differential visibility amplitude |dV| versus wavelength λ, normalised to 1 in the continuum (blue), and its decrease across the Hα profile. Uncertainties of |dV| are also plotted (grey). Synthetic visibilities (yellow) are shown for the two “extreme” values of the shell’s outer radius Routsh = 40 R⊙ (top) and 120 R⊙ (bottom).
Current usage metrics show cumulative count of Article Views (full-text article views including HTML views, PDF and ePub downloads, according to the available data) and Abstracts Views on Vision4Press platform.
Data correspond to usage on the plateform after 2015. The current usage metrics is available 48-96 hours after online publication and is updated daily on week days.
Initial download of the metrics may take a while.