Fig. 4.
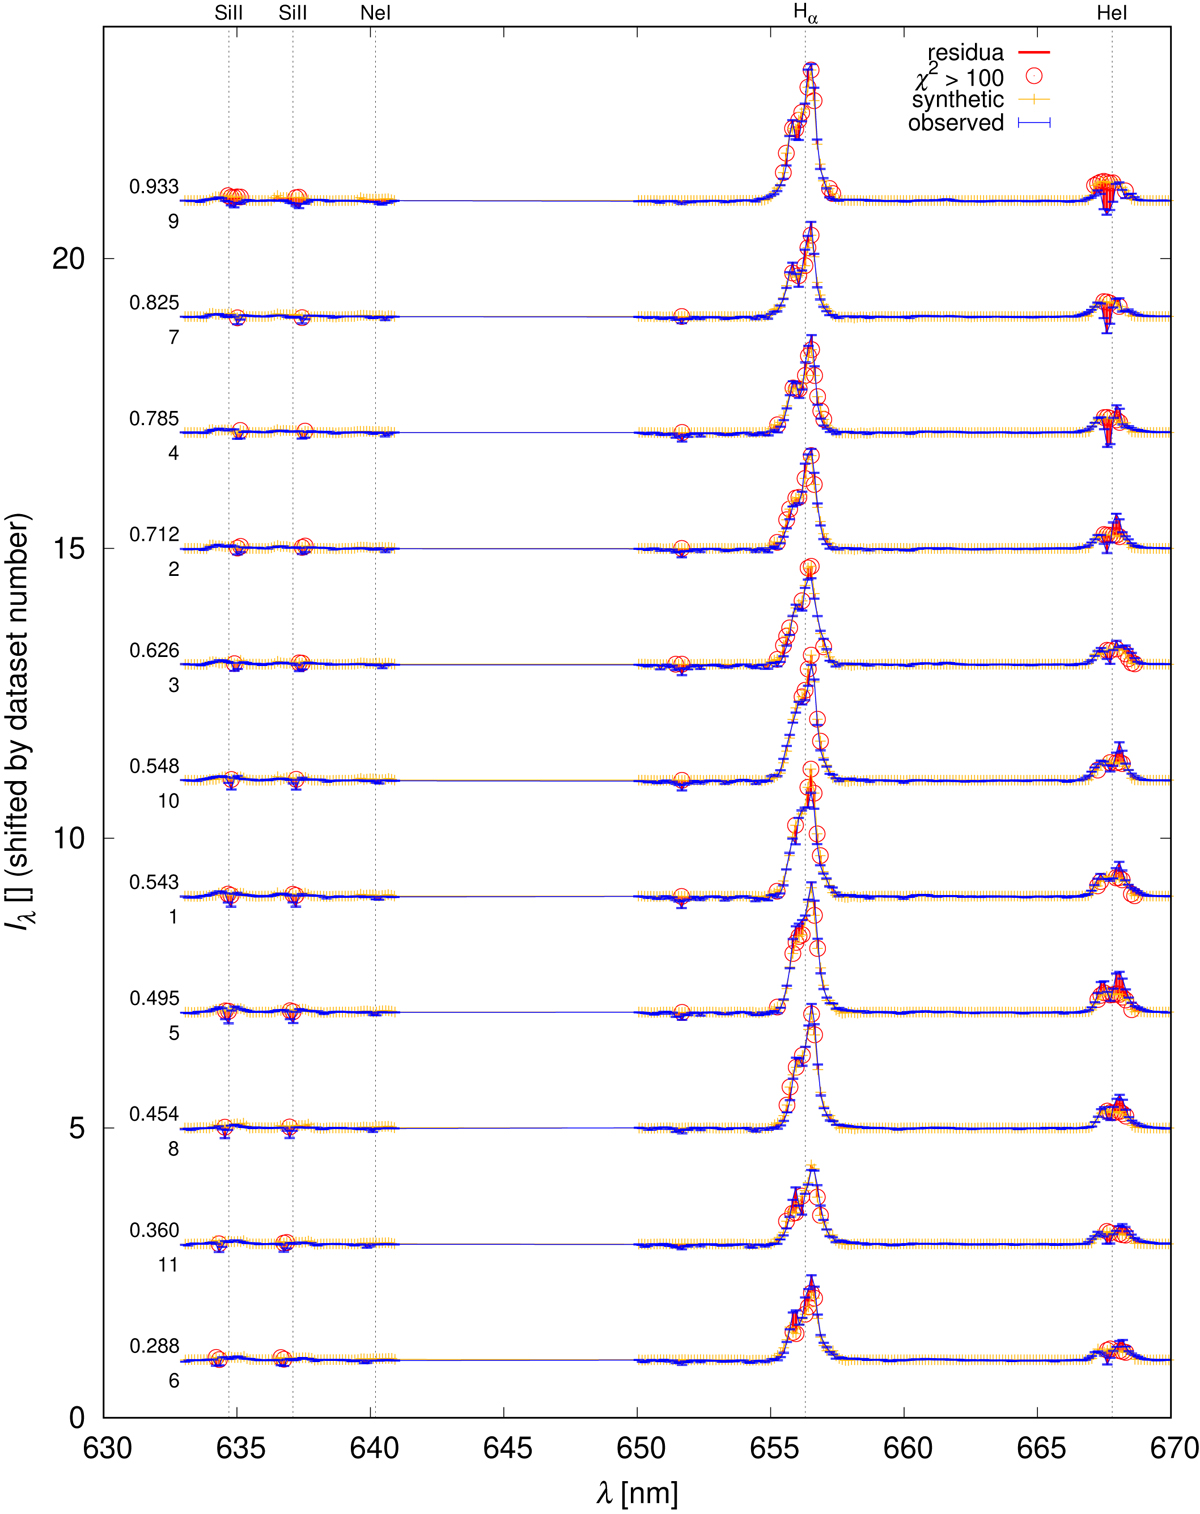
Normalised spectra for 11 phases covering the whole light curve, including primary and secondary eclipses. Colours in this figure, as well as in others, have the same meaning as in Fig. 3. The synthetic Hα profiles for the second model exhibit a variability similar to the observed ones, although at several phases there are systematic differences (both + and −).
Current usage metrics show cumulative count of Article Views (full-text article views including HTML views, PDF and ePub downloads, according to the available data) and Abstracts Views on Vision4Press platform.
Data correspond to usage on the plateform after 2015. The current usage metrics is available 48-96 hours after online publication and is updated daily on week days.
Initial download of the metrics may take a while.